
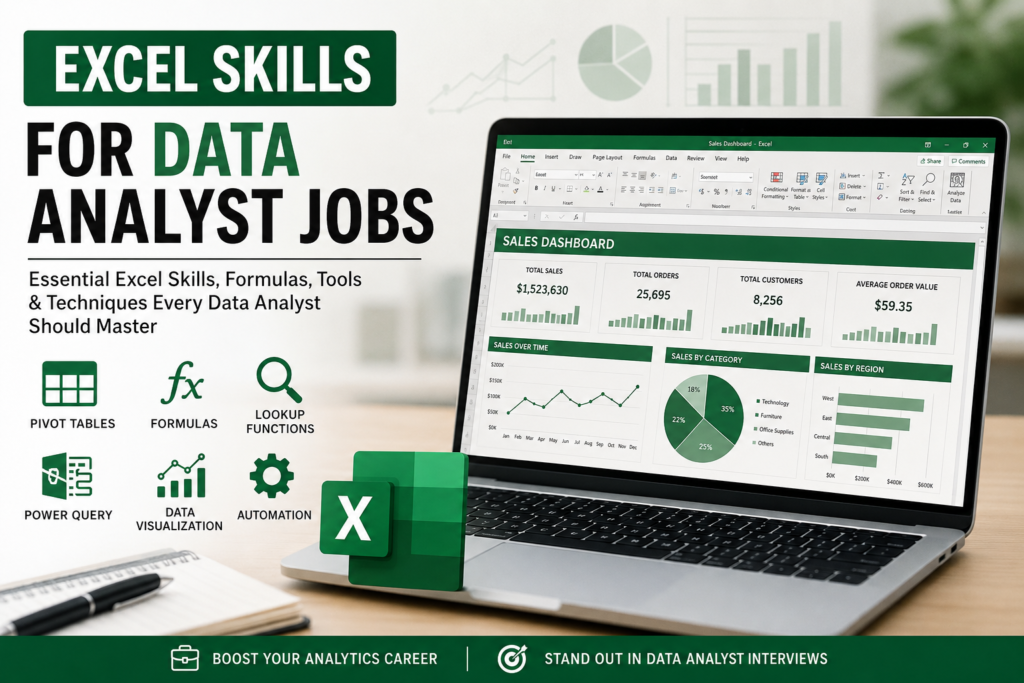
Excel Skills for Data Analyst Jobs: Complete Guide for Beginners and Professionals
Excel continues to be one of the most important tools used in data analyst jobs across the United States. Even in 2026, companies still rely heavily on Microsoft Excel for reporting, data cleaning, dashboard creation, forecasting, and business analysis.
Many beginners assume that tools like Python or Power BI have completely replaced Excel. But in reality, Excel remains the foundation of business analytics in thousands of companies.
If you want to become a data analyst or improve your chances of getting hired in the USA job market, learning advanced Excel skills can make a huge difference.
Why Excel Is Still Important for Data Analyst Jobs
Businesses deal with large amounts of data every day. Managers need quick reports, easy-to-understand dashboards, and fast analysis. Excel helps companies do all of this efficiently.
One major reason companies still prefer Excel is simplicity. Most employees already know the basics, which makes collaboration easier.
Why companies still use Excel:
- Easy to learn and use
- Excellent for quick reporting
- Works well with business teams
- Perfect for dashboards and summaries
- Integrates with Power BI and SQL
- Available in most organizations
Because of this, recruiters often mention Excel skills directly in data analyst job descriptions.
Essential Excel Skills Every Data Analyst Should Learn
1. Data Cleaning Skills
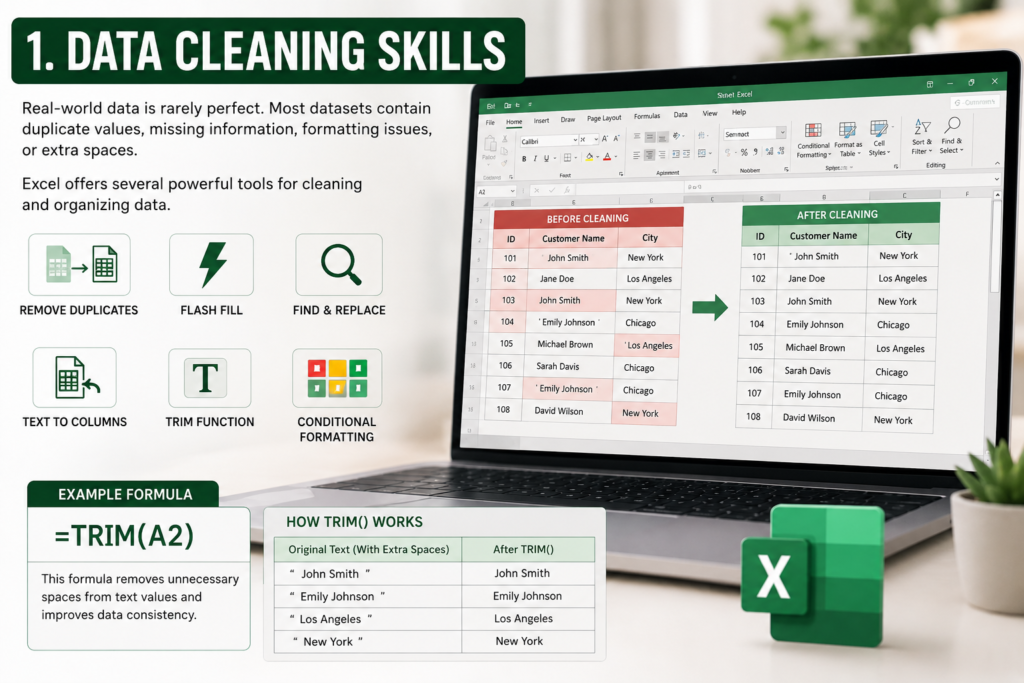
Real-world data is rarely perfect. Most datasets contain duplicate values, missing information, formatting issues, or extra spaces.
Before analysis begins, data analysts spend a significant amount of time cleaning and organizing data.
Excel offers several powerful tools for this process.
- Remove Duplicates
- Flash Fill
- Find and Replace
- Text to Columns
- TRIM Function
- Conditional Formatting
Example Formula:
=TRIM(A2)
This formula removes unnecessary spaces from text values and improves data consistency.
2. Excel Formulas and Functions
Formulas are the heart of Excel analysis. Data analysts use formulas to calculate results, automate tasks, and extract insights from raw data.
Most Important Excel Functions for Analysts
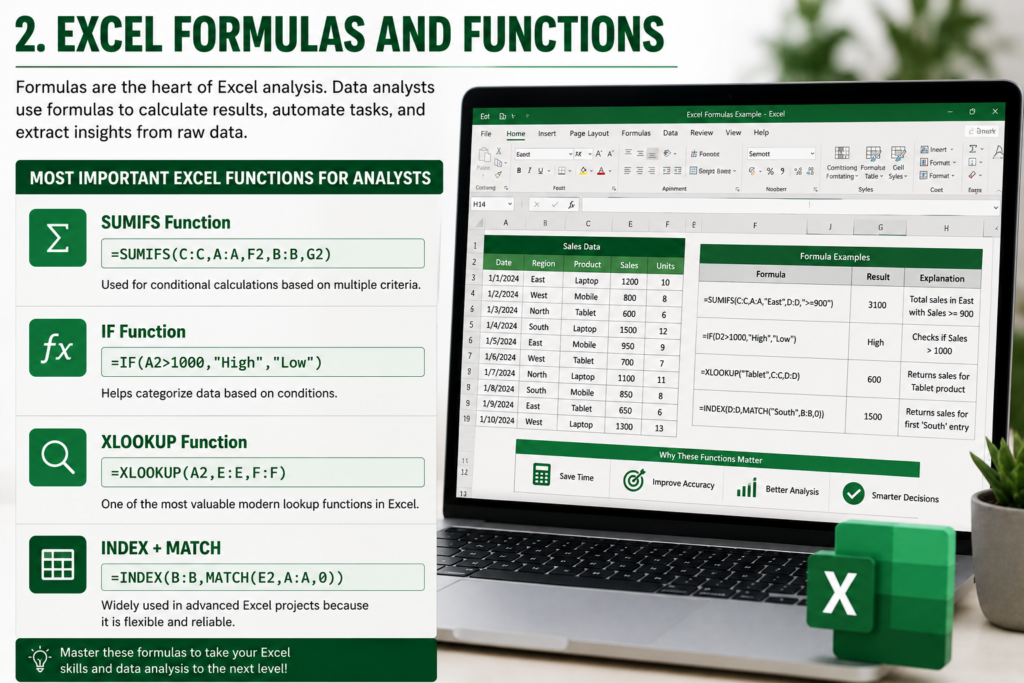
SUMIFS Function
=SUMIFS(C:C,A:A,F2,B:B,G2)
Used for conditional calculations based on multiple criteria.
IF Function
=IF(A2>1000,"High","Low")
Helps categorize data based on conditions.
XLOOKUP Function
=XLOOKUP(A2,E:E,F:F)
One of the most valuable modern lookup functions in Excel.
INDEX + MATCH
=INDEX(B:B,MATCH(E2,A:A,0))
Widely used in advanced Excel projects because it is flexible and reliable.
3. Pivot Tables
Pivot Tables are one of the most requested Excel skills in data analyst interviews.
They help summarize large datasets quickly without writing complex formulas.
Pivot Tables are commonly used for:
- Sales reporting
- Revenue analysis
- Regional performance tracking
- Monthly trend analysis
- Customer segmentation
Recruiters value Pivot Table skills because they save time and simplify business reporting.
4. Dashboard and Data Visualization Skills
Data analysis is not just about numbers. Businesses also need clear visual reports that managers can understand quickly.
Excel dashboards help transform raw data into meaningful business insights.
Important Dashboard Components
- Charts
- Slicers
- KPIs
- Interactive filters
- Conditional formatting
- Dynamic tables
| Chart Type | Best Use |
|---|---|
| Bar Chart | Comparing categories |
| Line Chart | Trend analysis |
| Pie Chart | Percentage distribution |
| Scatter Plot | Relationship analysis |
| Combo Chart | Multiple metrics |
5. Power Query Skills
Power Query has become one of the most valuable Excel tools for modern data analysts.
Instead of manually cleaning data every day, analysts can automate repetitive workflows using Power Query.
Power Query helps analysts:
- Import large datasets
- Merge multiple files
- Transform messy data
- Automate reporting processes
- Reduce manual work
Many companies now consider Power Query a highly valuable analytics skill.
6. Excel Tables and Structured References
Professional analysts rarely work with simple cell ranges anymore.
Excel Tables improve spreadsheet organization and make formulas easier to manage.
Example Formula:
=SUM(Table1[Sales])
Structured references make spreadsheets cleaner, scalable, and easier to maintain.
7. Conditional Formatting
Conditional Formatting helps analysts identify trends and patterns visually.
It is commonly used to:
- Highlight low sales
- Detect duplicate records
- Track KPI performance
- Identify missing values
- Show high-performing products
This improves reporting clarity and helps decision-makers focus on important metrics faster.
8. Advanced Excel Analysis Skills
Experienced data analysts often use advanced Excel features for forecasting and decision-making.
- Goal Seek
- Scenario Manager
- What-If Analysis
- Solver Add-in
These tools are especially useful in finance, operations, and business planning roles.
9. VBA and Automation Skills
While VBA is not required for every data analyst role, automation skills can provide a strong competitive advantage.
Macros and VBA help automate repetitive tasks such as:
- Formatting reports
- Cleaning data
- Exporting files
- Generating dashboards
- Consolidating multiple sheets
Companies appreciate automation because it saves time and reduces errors.
Most In-Demand Excel Skills for Data Analyst Jobs
| Skill | Demand Level |
|---|---|
| Pivot Tables | Very High |
| XLOOKUP | Very High |
| Power Query | Very High |
| Dashboard Creation | Very High |
| Data Cleaning | Essential |
| Conditional Formatting | High |
| VBA Automation | Medium to High |
| Charts and Visualization | High |
How to Learn Excel for Data Analyst Jobs
Start With the Basics
- Formatting
- Sorting and filtering
- Basic formulas
- Charts
Move to Intermediate Skills
- Pivot Tables
- Lookup functions
- Conditional Formatting
- Data Validation
Learn Advanced Features
- Power Query
- Dashboards
- Automation
- Forecasting tools
The best way to improve is by working on real-world projects.
Best Excel Projects for Your Portfolio
Recruiters prefer candidates who can demonstrate practical skills.
- Sales Dashboard
- Expense Tracker
- Inventory Management System
- HR Analytics Dashboard
- Financial Forecast Report
Building projects like these can make your resume much stronger.
Common Mistakes Beginners Make
Memorizing Formulas Without Understanding
Understanding logic is more important than memorizing formulas.
Ignoring Data Cleaning
Poor-quality data leads to inaccurate analysis.
Using Too Much Manual Work
Learning automation can save hours of repetitive effort.
Overcomplicated Dashboards
Simple and clear dashboards are usually more effective.
Excel vs Other Data Analyst Tools
Excel vs SQL
SQL is better for managing large databases, while Excel is excellent for quick reporting and flexible analysis.
Excel vs Python
Python handles automation and large-scale analytics more efficiently, but Excel remains easier for many business users.
Excel vs Power BI
Power BI is stronger for advanced visualizations, but Excel continues to be extremely useful for spreadsheet-based analysis.
Are Excel Skills Enough for a Data Analyst Job?
Excel can help you qualify for entry-level data analyst jobs.
However, combining Excel with tools like SQL, Power BI, Tableau, or Python can improve career growth and salary potential significantly.
Still, Excel remains one of the most important foundations for analytics careers.
Final Thoughts
Excel continues to be one of the most valuable skills for data analyst jobs in the USA.
Companies need professionals who can clean data, build reports, create dashboards, and generate meaningful business insights quickly.
The best approach is to focus on practical experience instead of only theoretical learning.
Start with formulas, Pivot Tables, and dashboards. Then gradually move toward automation, Power Query, and advanced analytics tools.
With consistent practice, Excel can become a powerful career skill that opens doors to multiple analytics opportunities.
Frequently Asked Questions
Is Excel required for data analyst jobs?
Yes. Most entry-level and mid-level data analyst roles require Excel skills.
Which Excel skill is most important?
Pivot Tables, XLOOKUP, Power Query, and dashboard creation are among the most valuable skills.
Can I become a data analyst with only Excel?
Some entry-level roles may hire candidates with strong Excel skills, but learning SQL and Power BI is highly recommended.
Do companies still use Excel in 2026?
Yes. Excel remains widely used across finance, operations, HR, marketing, and business analytics industries.

Pingback: Excel Invoice Tracker Guide 2026 - Excel AI Tools and SEO Guides
Pingback: How to Create a Drop-Down List in Excel (Step-by-Step Guide 2026) - Excel AI Tools and SEO Guides