

Household Budget Tracker :- Take control of your household budget with this Excel finance tracker featuring a dashboard, expense tracking, monthly budgets, savings goals, debt planning and net worth tracking.
I Turned a Simple Excel Expense Sheet Into a Complete Household Finance Dashboard
Managing household money sounds simple.
You earn money, pay your bills, buy groceries, save what you can, and hopefully have something left at the end of the month.
But when you actually start tracking everything, things get complicated very quickly.
Rent is in one place. Credit-card spending is somewhere else. Investments are tracked separately. Savings goals are usually just a number in your head.
And that’s exactly the problem I wanted to solve with this Excel household finance tracker.
Instead of creating another basic spreadsheet with a few expense columns, I built a complete household budgeting and personal finance workbook that brings everyday spending, budgeting, savings goals, debt and net worth into one place.
The result is a much more practical Excel finance dashboard that you can actually use month after month.
Why a basic expense tracker isn’t enough
That’s useful.
But after a few weeks, you still have to answer questions like:
- How much did I actually spend this month?
- Which category is consuming the most money?
- Am I staying within my budget?
- How much am I saving?
- How much did I spend compared with previous months?
- Am I making progress toward my savings goals?
- What is my current net worth?
- How much debt do I still have?
A list of transactions doesn’t answer all of those questions.
So I designed the workbook around one central transaction system, with the other sections using that information automatically.
The Excel Household Finance Dashboard
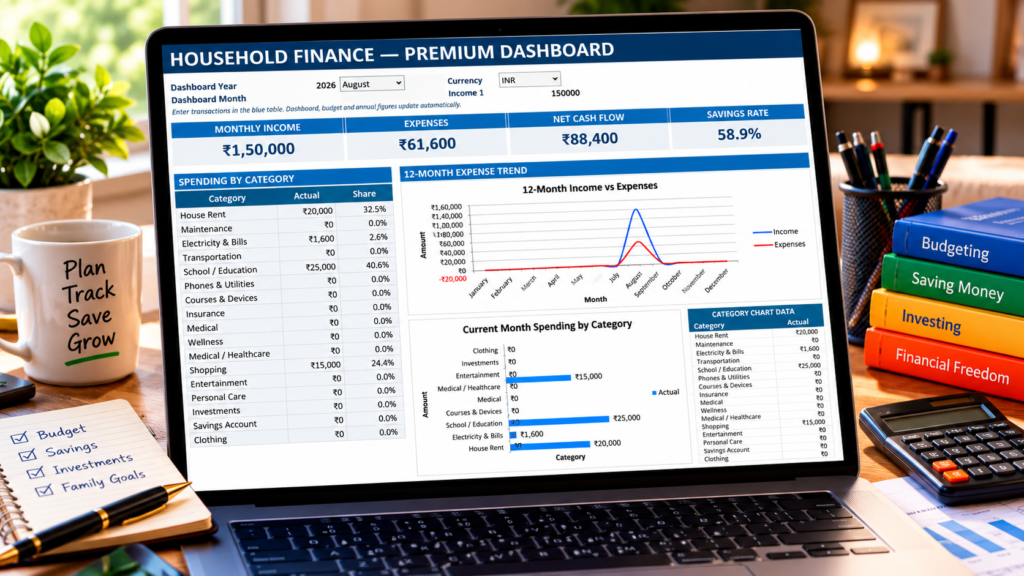
The first thing you see is the dashboard.
Instead of opening a spreadsheet and immediately staring at hundreds of rows, the dashboard gives you a quick overview of your financial picture.
It focuses on four important numbers:
Monthly Income
How much money came into the household during the selected month.
Monthly Expenses
How much was actually spent.
Net Cash Flow
Income minus expenses.
Savings Rate
The percentage of income remaining after expenses.
For example, with the sample data in the workbook:
Income: ₹150,000
Expenses: ₹61,600
Net Cash Flow: ₹88,400
Savings Rate: 58.9%
The numbers aren’t meant to represent an ideal financial situation. They’re simply example data that demonstrates how the dashboard works.
Everything Starts With the Transactions Sheet
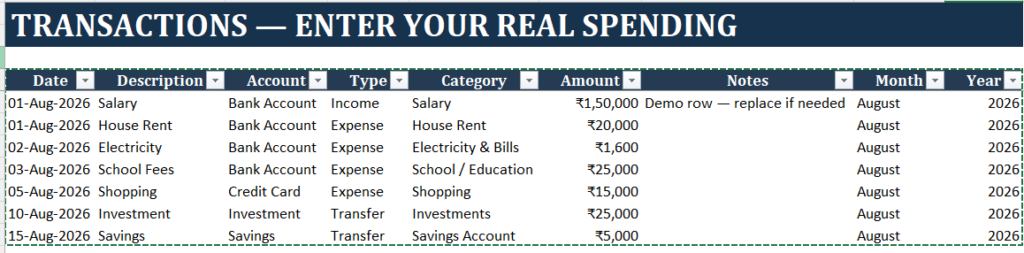
The Transactions sheet is the engine behind the workbook.
This is where you enter your everyday financial activity.
You don’t need to manually calculate the month and year.
Excel handles those fields automatically.
That becomes important because the dashboard and annual reports can then filter transactions by month and year.
Income, Expenses and Transfers Are Separated
One small design decision makes a big difference.
The workbook separates transactions into:
- Income
- Expense
- Transfer
Why does that matter?
Suppose you move ₹25,000 from your bank account into an investment account.
That’s not really household spending.
If you simply record every outgoing bank transaction as an expense, your spending numbers become misleading.
By separating transfers from expenses, the dashboard can focus on actual household spending.
This is one of those small details that makes a budgeting spreadsheet much more useful in real life.
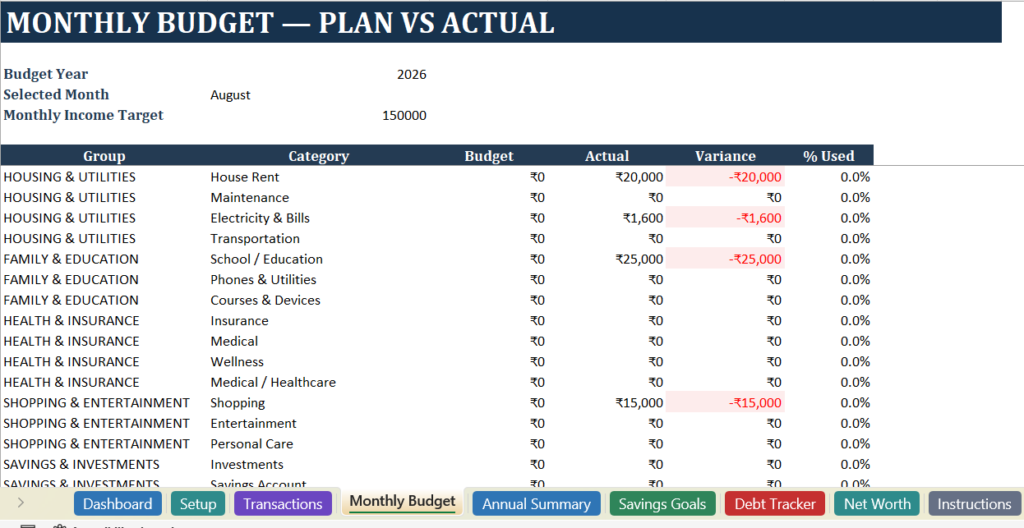
Monthly Budget: Plan vs. Actual
The next important section is the Monthly Budget.
This is where the spreadsheet becomes more than an expense tracker.
You can enter a planned amount for each category and compare it with what you actually spent.
This makes overspending much easier to identify.
Instead of asking:
“Where did my money go?”
you can ask:
“Which parts of my plan didn’t go as expected?”
That’s a much more useful question.
The Annual Summary Shows the Bigger Picture
Monthly tracking is useful, but sometimes you need to step back.
The Annual Summary gives you a 12-month view of:
- Income
- Expenses
- Transfers
- Net cash flow
- Savings rate
This helps reveal patterns that are difficult to see when you’re looking at only one month.
For example, maybe your spending is reasonable most months but increases significantly during:
- school admission periods
- holidays
- insurance renewal months
- festivals
- annual subscriptions
- large household purchases
A yearly view helps you see those patterns instead of treating every month as an isolated event.
Savings Goals Make the Spreadsheet More Goal-Oriented
Another section I wanted to include was Savings Goals.
Saving money without a specific purpose can be difficult.
So the workbook allows you to create goals such as:
- Emergency Fund
- Home Down Payment
- Vacation
- Education
- Car / Vehicle
- Annual Insurance
- Big Purchase
- Other
For each goal, you can track:
Target Amount → Starting Amount → Contributions → Remaining Amount → Progress
The idea is simple.
Instead of seeing savings as one large number, you can give your money a purpose.
Debt Payoff Planner
Debt is another area that is often tracked separately from household budgeting.
The workbook includes a dedicated Debt Tracker where you can record:
- Original balance
- Current balance
- APR
- Minimum payment
- Extra payment
- Total monthly payment
- Estimated payoff period
For someone managing multiple debts, having this information beside the household budget can make the overall financial picture much easier to understand.
The payoff calculation is an estimate based on the entered balance, interest rate and payment amount. Actual lender calculations can differ because of payment timing, fees, interest conventions and other terms.
Net Worth Tracker
Income tells you how much money is coming in.
Expenses tell you how much is going out.
But neither tells you the full financial picture.
That’s why I also included a Net Worth section.
You can track assets such as:
- Bank accounts
- Savings
- Investments
- Cash
and liabilities such as:
- Credit cards
- Loans
The workbook then calculates:
Net Worth = Total Assets − Total Liabilities
This is particularly useful when you’re trying to understand whether your overall financial position is improving over time.
The Dashboard Charts Are Connected to the Data
One of the biggest problems with many downloadable Excel templates is that the dashboard looks impressive but doesn’t actually behave like a dashboard.
I wanted to avoid that.
The charts in this workbook are connected to formula-driven data.
The dashboard includes a 12-month income vs. expenses chart, along with a category spending chart.
When transactions change, the underlying calculations update.
The workbook also uses automatic calculation settings so that Excel can recalculate formulas when the data changes.
I Also Added a Setup and Instructions Section
A premium spreadsheet shouldn’t require the user to reverse-engineer it.
The workbook therefore includes a setup area and instructions explaining the basic workflow.
The intended process is:
Step 1
Set your year and basic preferences.
Step 2
Enter transactions.
Step 3
Set your monthly budget.
Step 4
Create savings goals.
Step 5
Enter debt information if applicable.
Step 6
Update your net worth.
Step 7
Use the dashboard to review your financial picture.
Once the initial setup is complete, the daily workflow is intentionally simple:
Enter transactions → Review dashboard → Adjust your budget when necessary.
What Makes This Different From a Simple Excel Budget?
The main difference isn’t the number of sheets.
It’s the way the workbook connects them.
The transaction data becomes the foundation for:
Transactions
↓
Monthly Budget
↓
Dashboard
↓
Annual Summary
while separate sections handle:
Savings Goals
Debt
Net Worth
That creates a much more complete household finance system than a simple monthly expense list.
Who Is This Excel Budget Template For?
This type of workbook can be useful for:
- Families managing household expenses
- Couples combining household finances
- Individuals who want a structured budget
- People saving for a house
- People working toward an emergency fund
- Anyone trying to reduce unnecessary spending
- Excel users who prefer spreadsheets over finance apps
- People who want to understand their monthly cash flow
It’s also useful for anyone who wants more control over their financial data without handing everything over to a third-party budgeting application.
A Simple Way to Use It Every Month
You don’t need to spend hours maintaining the workbook.
A practical routine is:
During the month:
Enter transactions as they happen.
Once a week:
Check your category spending.
At the end of the month:
Review your budget vs. actual numbers.
Every few months:
Review your savings goals and net worth.
At the end of the year:
Use the annual summary to understand your spending patterns.
The goal isn’t to create more spreadsheet work.
The goal is to make the spreadsheet do more of the work for you.
Download the Excel Household Budget Tracker
What’s included
✓ Finance Dashboard
✓ Transaction Tracker
✓ Monthly Budget Planner
✓ Annual Financial Summary
✓ Savings Goal Tracker
✓ Debt Payoff Planner
✓ Net Worth Tracker
✓ Setup & Instructions
✓ Automatic calculations
✓ Dynamic dashboard charts
Note: This spreadsheet is a budgeting and tracking tool, not financial advice. The example numbers are for demonstration purposes and should be replaced with your own information.
Final Thoughts
A household budget doesn’t need to be complicated.
But it does need to answer the questions that actually matter.
Where is my money going?
Am I staying within my plan?
How much am I saving?
Am I making progress toward my goals?
Is my overall financial position improving?
That’s what I wanted this Excel template to accomplish.
Rather than creating another spreadsheet that simply records expenses, I built something that gives the data a purpose — track it, understand it, and use it to make better day-to-day financial decisions.

