
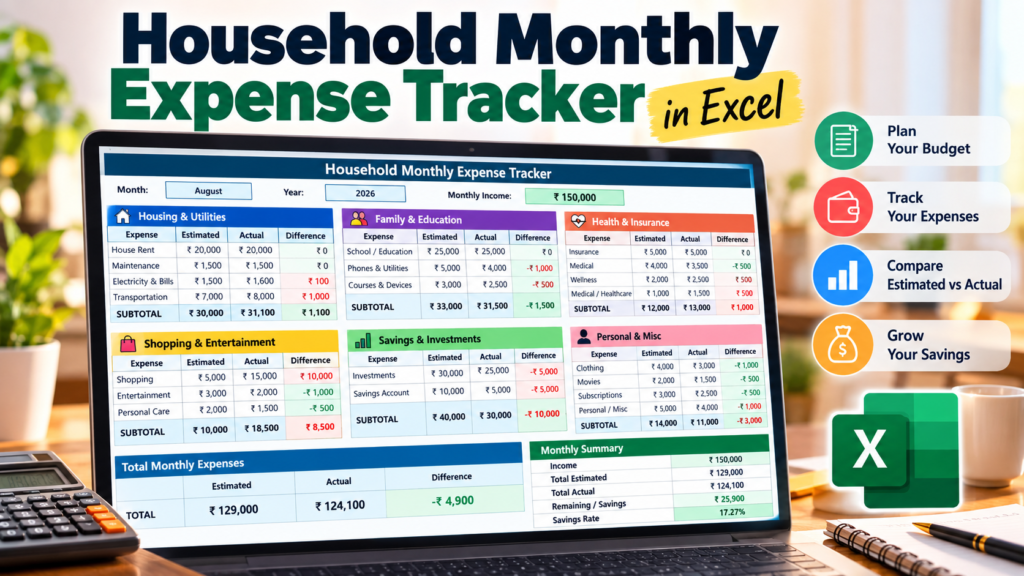

Monthly Expenses in Excel: Keeping track of household expenses can become difficult when rent, utilities, transportation, education, shopping, subscriptions, savings and other payments are spread across different places.
A simple Excel spreadsheet can bring all of those numbers together.
The Household Monthly Expense Tracker is designed to help you plan your monthly budget, record actual spending and quickly see where your expenses are higher or lower than expected.
What makes this approach useful is the comparison between Estimated, Actual and Difference amounts. Instead of simply recording what you spent, you can compare your spending with the budget you created at the beginning of the month.
The workbook also includes a Monthly Tracker, Instructions and Blank Template, making it possible to start with the example and then create your own monthly budget.
What Is a Monthly Expense Tracker in Excel?
A monthly expense tracker is an Excel spreadsheet that organizes your income and expenses for a specific month.
A basic expense list tells you how much you spent. A budget tracker goes a step further by comparing your planned spending with your actual spending.
The structure is simple:
Estimated → Actual → Difference
For example, if you plan to spend ₹5,000 on shopping but actually spend ₹15,000, the spreadsheet immediately shows that you went ₹10,000 over your original budget.
That difference can be more useful than the expense amount alone because it highlights where your spending changed.
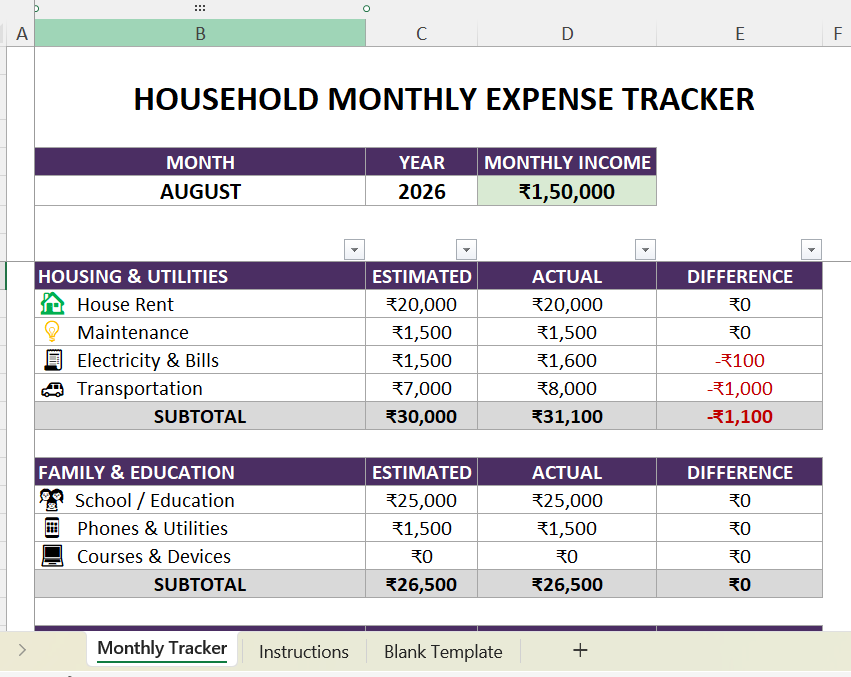
What’s Included in This Household Expense Tracker?
The workbook contains three worksheets:
Monthly Tracker
This is the main worksheet where you enter your monthly income, estimated expenses and actual expenses.
It is divided into several household spending categories and includes automatic calculations for subtotals and the monthly summary.
Instructions
The Instructions sheet explains how to use the tracker in six simple steps.
You start by entering the month, year and income, then add your estimated and actual expenses before reviewing the automatically calculated results.
Blank Template
The Blank Template provides a clean version that can be used for a new month.
This is useful because you don’t have to remove the previous month’s figures and rebuild the tracker every time.
Download 👇
Start With Your Monthly Income
The tracker begins with three basic pieces of information:
- Month
- Year
- Monthly Income
The example in the workbook uses August 2026 with a monthly income of ₹150,000.
Your own figures can be entered here when you begin using the template.
Starting with income provides the reference point for understanding how much of your monthly money is going toward expenses and how much remains afterward.
1. Track Housing and Utilities
Housing and regular household bills are often some of the most predictable monthly expenses.
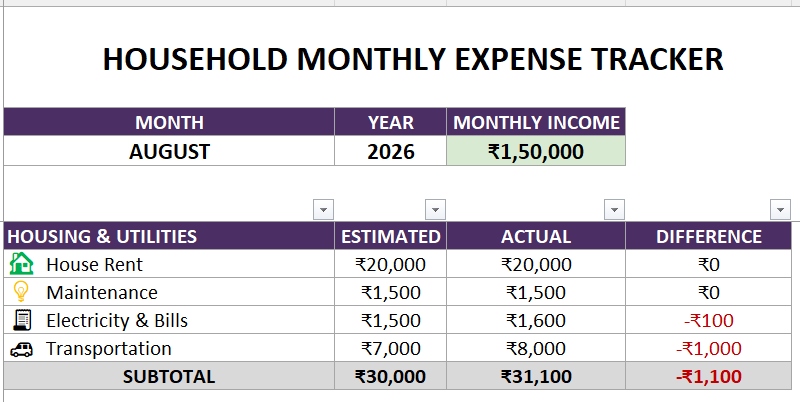
The tracker provides a dedicated section for:
- House Rent
- Maintenance
- Electricity & Bills
- Transportation
For example, the sample workbook contains planned and actual amounts for each category.
| Expense | Estimated | Actual |
|---|---|---|
| House Rent | ₹20,000 | ₹20,000 |
| Maintenance | ₹1,500 | ₹1,500 |
| Electricity & Bills | ₹1,500 | ₹1,600 |
| Transportation | ₹7,000 | ₹8,000 |
The difference column makes it easier to see where actual spending moved away from the original plan.
In this example, electricity and transportation are higher than estimated, while rent and maintenance remain at the planned amounts.
2. Keep Family and Education Expenses Together
The next section focuses on expenses related to family and education.
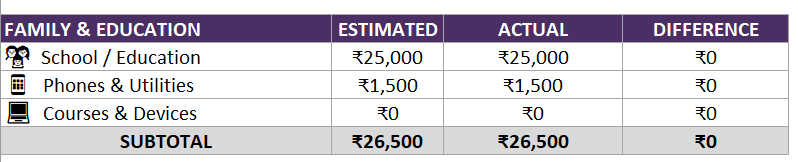
It includes categories such as:
- School / Education
- Phones & Utilities
- Courses & Devices
Keeping these expenses in their own section makes the monthly budget easier to read.
Education and technology expenses can also vary from month to month, so comparing estimated and actual amounts can help when preparing the following month’s budget.
3. Track Health and Insurance Costs
Healthcare and insurance deserve their own place in a household budget because some of these expenses may be recurring while others can be unpredictable.
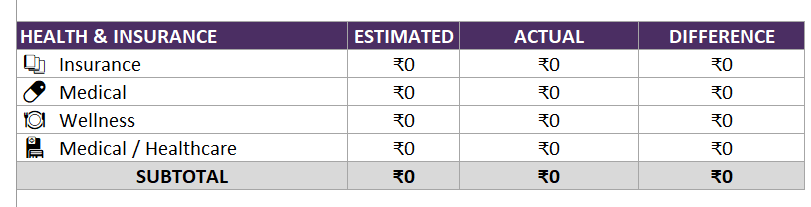
The tracker includes categories for:
- Insurance
- Medical
- Wellness
- Medical / Healthcare
At the beginning of the month, you can enter the amount you expect to spend.
As the month progresses, update the Actual column.
The Difference column then gives you a quick view of how the actual expense compares with your estimate.
4. See How Much You’re Spending on Shopping and Entertainment
Discretionary spending can be harder to control because individual purchases may seem relatively small.
The tracker separates these expenses into categories such as:
- Shopping
- Entertainment
- Personal Care
The sample data shows why the Estimated vs. Actual comparison can be useful.
For Shopping, the estimated amount is ₹5,000, while the actual amount is ₹15,000.
That’s a ₹10,000 difference.
Looking at the actual amount alone tells you that ₹15,000 was spent.
Looking at the difference tells you something more useful:
₹10,000 more was spent than originally planned.
That information can help when setting the next month’s budget.
5. Don’t Forget Savings and Investments
A household budget shouldn’t only focus on expenses.
The tracker includes a dedicated Savings & Investments section with:
- Investments
- Savings Account
In the sample workbook, the estimated investment amount is ₹30,000 and the actual amount is ₹25,000.
The Savings Account category has an estimated amount of ₹10,000 and an actual amount of ₹5,000.
This makes it possible to review planned savings alongside household expenses.
That distinction is important because a month can appear to be under control from an expense perspective while still falling short of a planned savings target.
6. Track Personal and Miscellaneous Expenses
Not every expense fits neatly into a major household category.
The tracker therefore includes a Personal & Misc section.
Examples include:
- Clothing
- Movies
- Subscriptions
- Personal / Misc
These categories can be adapted to your own requirements.
For example, you could replace them with groceries, fuel, travel, childcare or other expenses that are more relevant to your household.
Estimated vs. Actual: The Part That Makes Budgeting More Useful
One of the most practical features of this spreadsheet is the separation between Estimated and Actual spending.
Consider this simple example:
| Category | Estimated | Actual | Difference |
|---|---|---|---|
| Shopping | ₹5,000 | ₹15,000 | ₹10,000 |
| Electricity | ₹1,500 | ₹1,600 | ₹100 |
| Investments | ₹30,000 | ₹25,000 | ₹5,000 |
The numbers reveal different types of changes.
Shopping exceeded the original budget.
Electricity was slightly higher than expected.
Investment contributions were lower than planned.
This gives you information that a simple list of expenses doesn’t provide.
Why the Difference Column Matters
A monthly budget is essentially a plan.
Actual spending is what happened.
The Difference column shows the gap between the two.
That makes it easier to identify categories that deserve attention when you prepare your next monthly budget.
Over time, repeated differences can reveal spending patterns.
For example, if transportation is consistently above your estimate, your future budget may need a more realistic transportation allowance.
Automatic Subtotals Make the Tracker Easier to Review
Each major expense group includes a subtotal.
Instead of manually adding every item in a category, Excel calculates the section total for you.
This is useful when the number of expenses grows.
For example, the Housing & Utilities subtotal combines the relevant expenses into one figure, while other sections do the same for their categories.
You can therefore review the budget at two levels:
Individual expense → Category subtotal
and eventually:
Category subtotal → Total monthly expenses
Review Your Total Monthly Expenses
After the individual expense categories, the tracker calculates the total monthly expenses.
This gives you a quick overview of how much was spent across the different household categories.
The sample workbook compares:
- Total Estimated
- Total Actual
This is one of the first numbers to review at the end of the month.
If actual expenses are consistently higher than estimated expenses, it may be worth examining which categories are responsible for the difference.
The Monthly Summary Gives You a Quick Financial Snapshot
The final section of the tracker is the Monthly Summary.
It brings the important numbers together:
- Income
- Total Estimated
- Total Actual
- Remaining / Savings
- Savings Rate
Instead of going through every expense whenever you want to understand the month, you can start with this summary.
It provides a simple flow:
Income → Expenses → Remaining Money → Savings Rate
For the sample month, the workbook uses a monthly income of ₹150,000 and calculates the corresponding expense and savings figures from the tracker.
How to Use the Excel Expense Tracker
You don’t need to spend a lot of time maintaining the spreadsheet.
A simple monthly routine is enough.
Step 1: Enter your income
Add the income available for the month.
Step 2: Select the month and year
Update the month and year at the top of the tracker.
Step 3: Create your budget
Enter the amount you expect to spend in each category under Estimated.
Step 4: Record actual expenses
Update the Actual column as you make payments throughout the month.
Step 5: Review the differences
Check which categories are above or below the original estimate.
Step 6: Review the totals
Look at the category subtotals and total monthly expenses.
Step 7: Check the summary
Review remaining money and the savings rate.
Step 8: Start the next month
Use the Blank Template sheet when you’re ready to begin another monthly budget.
How This Can Help You Understand Your Spending
The value of a tracker becomes clearer when you use it for several months.
One month can show you what happened.
Several months can show you a pattern.
You may discover that:
- Transportation regularly exceeds the estimate.
- Shopping varies significantly between months.
- Some subscriptions are rarely used.
- Education expenses are relatively predictable.
- Savings contributions change from month to month.
- Certain categories consistently require a larger budget.
These observations can help you make your future estimates more realistic.
The spreadsheet itself doesn’t make financial decisions for you. It simply makes the numbers easier to see and compare.
Who Can Use This Excel Budget Tracker?
The template can be adapted for different situations.
Families
Track household expenses and savings in one spreadsheet.
Individuals
Monitor personal spending and monthly savings.
Couples
Keep shared household expenses organized.
Students
Track education, transportation and personal expenses.
Freelancers
Combine monthly income tracking with household expenses.
Excel Learners
Use the workbook as a practical example of formulas, subtotals and structured spreadsheet design.
Why Use Excel Instead of a Simple Expense List?
A simple list might look like this:
Rent — ₹20,000
Electricity — ₹1,600
Shopping — ₹15,000
Transportation — ₹8,000
That tells you what happened.
A structured budget tells you more:
What did I expect?
What actually happened?
What was the difference?
That’s the main reason an Excel budget tracker can be more useful than simply writing down expenses.
You can also customize the spreadsheet as your financial needs change.
You Can Customize the Template
The categories in the workbook are a starting point.
Depending on your situation, you can add or modify categories such as:
- Groceries
- Fuel
- Travel
- Childcare
- Internet
- EMI payments
- Pet expenses
- School fees
- Investments
- Emergency expenses
You can also change the formatting and expand the workbook with charts or additional analysis.
Because the tracker is built in Excel, you have control over how you want to organize the information.
A Simple Monthly Review Can Make the Numbers More Useful
At the end of every month, take a few minutes to review the tracker.
Ask yourself:
Which expenses were higher than expected?
Which expenses stayed within budget?
Did I save the amount I planned to save?
Which categories should have a different budget next month?
These questions turn the spreadsheet from a record-keeping tool into a monthly review habit.
Final Thoughts
A household budget doesn’t have to be complicated.
The Household Monthly Expense Tracker brings income, estimated expenses, actual expenses, differences, savings and a monthly summary together in one Excel workbook.
Its main idea is simple:
Don’t just record what you spent. Compare it with what you planned to spend.
That comparison can make it easier to understand your monthly spending and prepare a more realistic budget for the next month.
The workbook also includes an Instructions sheet and a Blank Template, so you can learn how it works and then start tracking your own expenses.
If you already use Microsoft Excel, this type of spreadsheet can be a practical starting point for organizing your household budget without needing a separate budgeting application.
Frequently Asked Questions
What is a monthly expense tracker?
A monthly expense tracker is a spreadsheet used to record income, planned expenses, actual spending and the difference between the two.
Can I use this Excel tracker for household expenses?
Yes. The template is organized around common household categories such as housing, education, healthcare, shopping, entertainment, savings and personal expenses.
Does the tracker compare estimated and actual expenses?
Yes. The main tracker includes separate Estimated and Actual columns and calculates the Difference.
Does the workbook include a blank template?
Yes. A separate Blank Template worksheet is included so you can start tracking a new month.
Can I customize the expense categories?
Yes. You can modify the categories to suit your own household and add expenses that aren’t included in the original template.
Can Excel calculate my savings rate?
Yes. The workbook uses formulas to calculate the monthly summary, including the savings-related figures.
Is this suitable for beginners?
Yes. The workbook includes an Instructions sheet explaining the basic steps for entering income, estimated expenses and actual expenses.

