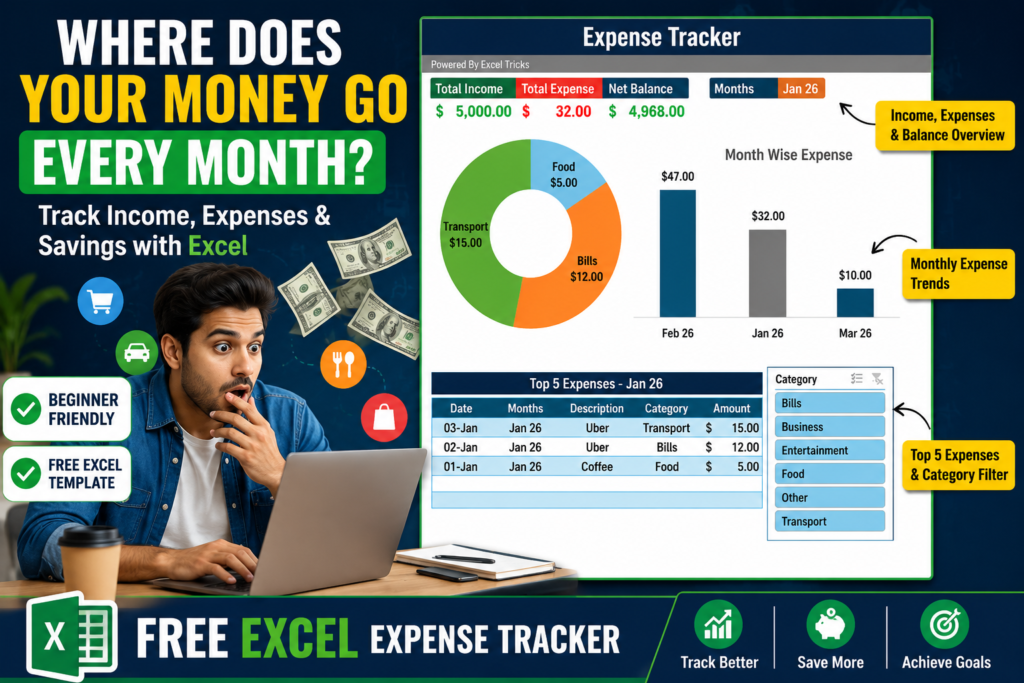
Excel Expense Tracker:-Have you ever reached the end of the month and wondered, “Where did all my money go?”
You’re not alone.
Most people know how much they earn, but very few know exactly where they spend their money. Small expenses like coffee, food delivery, subscriptions, fuel, and online shopping quietly add up throughout the month. Before you realize it, a large portion of your income is gone.
The problem isn’t always low income. In many cases, the real issue is not tracking expenses.
That’s exactly why I created this simple Excel Expense Tracker Dashboard. It’s easy to use, beginner-friendly, and helps you understand your spending habits without any complicated formulas or accounting knowledge.
Why Tracking Expenses Matters
Managing money starts with awareness.
If you don’t know where your money is going, it’s almost impossible to create a budget, increase savings, or achieve financial goals.
Expense tracking helps you:
- Understand your spending habits
- Identify unnecessary expenses
- Create a realistic budget
- Increase your savings
- Make better financial decisions
The good news is that you don’t need expensive software or mobile apps. A simple Excel dashboard can do the job effectively.
A Simple Expense Tracker Designed for Everyone
One of the biggest reasons people stop tracking expenses is because most tools are too complicated.
This Excel Expense Tracker was designed with simplicity in mind.
Whether you’re a student, working professional, freelancer, or business owner, you can start using it immediately.
The tracker consists of two simple sections:
Expense Entry
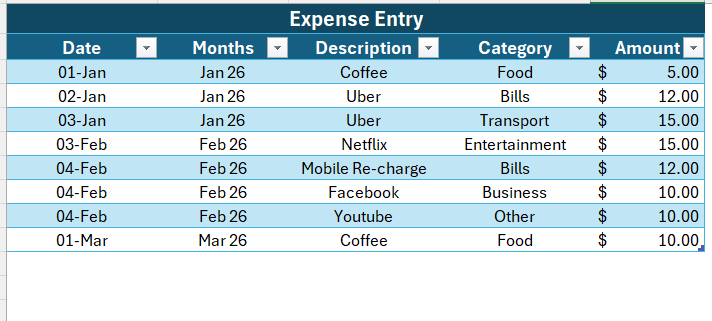
Whenever you spend money, simply enter:
- Date
- Description
- Category
- Amount
For example:
- Coffee → Food
- Uber → Transport
- Netflix → Entertainment
- Mobile Recharge → Bills
It takes only a few seconds to record each transaction.
Income Entry
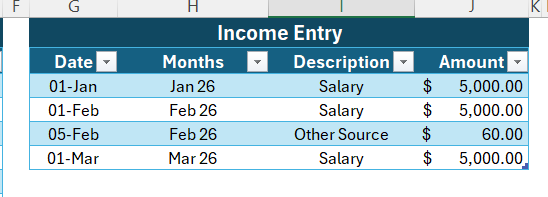
You can also track all your income sources in one place.
Examples include:
- Salary
- Freelance Income
- Business Revenue
- Other Sources
This gives you a complete picture of both money coming in and money going out.
Updating the Dashboard Is Extremely Easy
Many people think dashboards require technical knowledge.
Not this one.
After entering your income or expense data, simply:
- Right-click on the Pivot Table
- Click Refresh
- Done
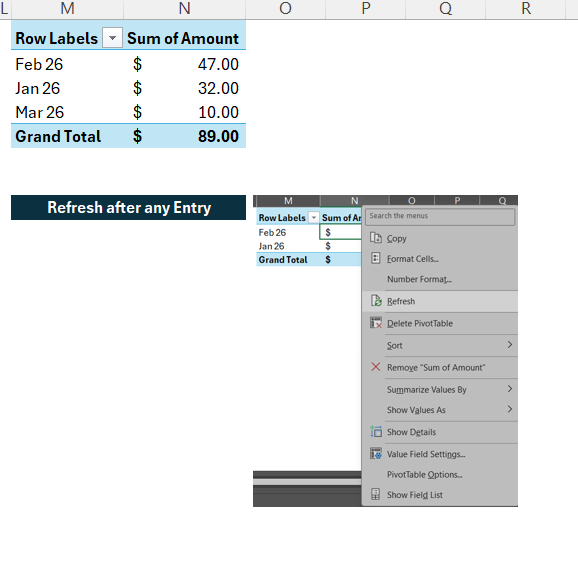
The dashboard updates instantly.
No formulas to edit.
No VBA knowledge required.
No complicated setup.
What Makes This Dashboard Useful?
The real power of this tracker comes from the dashboard.
Instead of looking at rows of data, you get clear visual insights that help you understand your finances immediately.
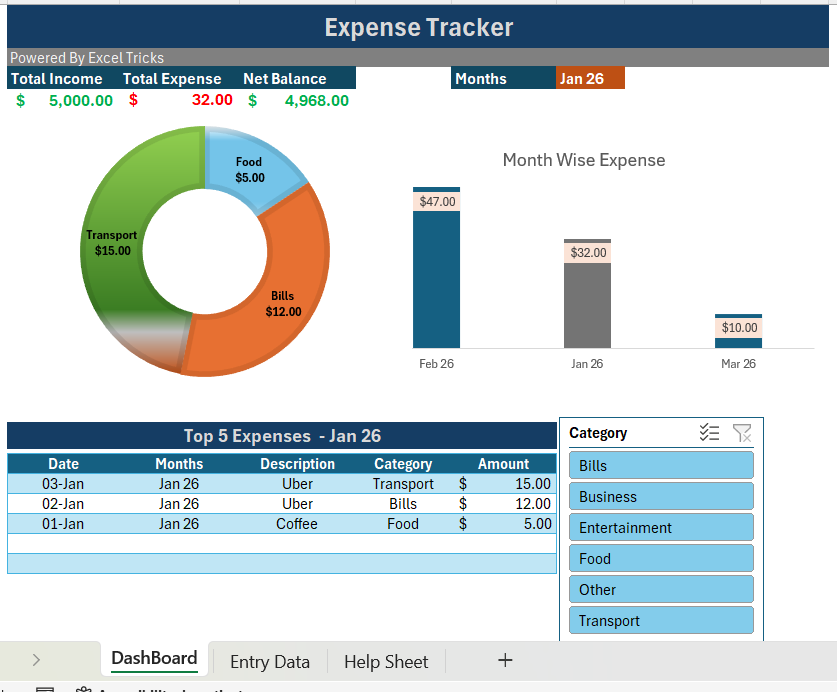
Total Income, Expenses, and Net Balance
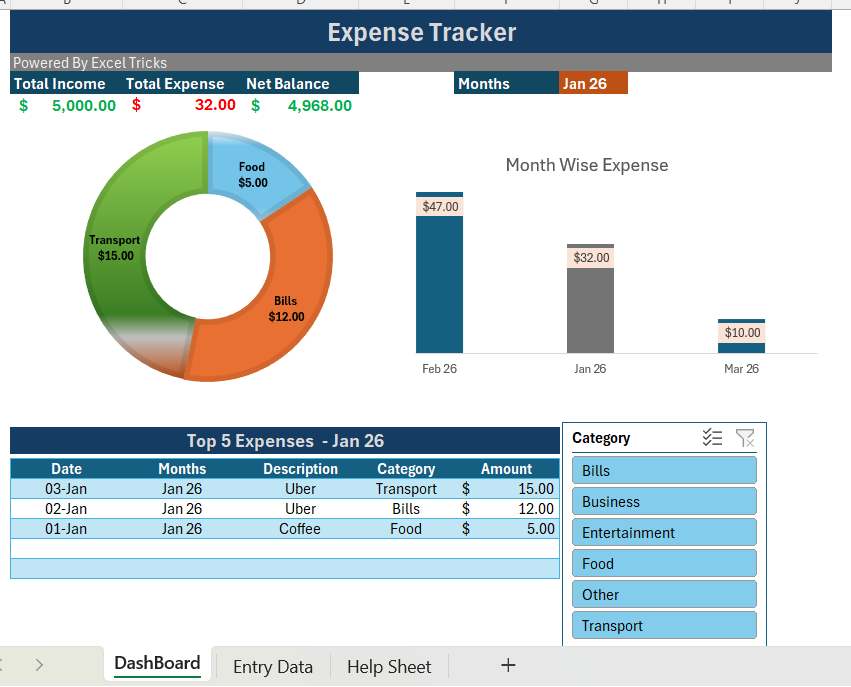
At the top of the dashboard, you’ll find three important metrics:
Total Income
Shows how much money you’ve earned.
Total Expense
Displays your total spending.
Net Balance
Automatically calculates:
Income – Expenses = Net Balance
This instantly tells you how much money you still have available.
Category-Wise Expense Analysis
One of my favorite features is the category-wise expense chart.
Most people know their total expenses, but they don’t know where the money was actually spent.
The dashboard automatically groups expenses into categories such as:
- Food
- Bills
- Transport
- Entertainment
- Business
- Other
This helps you quickly identify which category consumes the largest portion of your income.
For example, you might discover that food delivery costs are higher than expected or that entertainment subscriptions are taking a larger share of your budget.
These insights are often eye-opening.
Track Your Monthly Spending Trends
Another useful feature is the Month Wise Expense Chart.
The dashboard automatically compares your expenses across different months.
This allows you to answer questions like:
- Which month had the highest expenses?
- Am I spending more than last month?
- Are my expenses increasing over time?
Instead of guessing, you can see the trend clearly through the chart.
This makes budgeting and financial planning much easier.
Identify Your Top 5 Expenses
Sometimes a few large expenses have a bigger impact than dozens of small ones.
That’s why the dashboard includes a Top 5 Expenses section.
This feature automatically shows the highest expenses for the selected month.
It helps you:
- Spot spending leaks
- Control unnecessary purchases
- Make smarter budgeting decisions
- Focus on the expenses that matter most
A simple feature, but extremely valuable.
Interactive Filters for Better Analysis
The dashboard also includes category filters.
With a single click, you can filter the entire report by category.
Want to see only Food expenses?
Click Food.
Want to analyze Entertainment spending?
Click Entertainment.
The charts and reports update instantly.
This makes the dashboard feel dynamic and interactive while remaining simple to use.
Who Can Use This Expense Tracker?
The beauty of this tracker is that anyone can use it.
Students
Track monthly allowances and spending habits.
Employees
Monitor salary, expenses, and savings.
Freelancers
Manage multiple income streams and business expenses.
Small Business Owners
Track operational expenses and cash flow.
Families
Monitor household budgets and monthly spending.
Final Thoughts
Most people work hard to earn money but spend very little time understanding where that money goes.
A simple habit of tracking expenses can completely change your financial life.
This Excel Expense Tracker makes that process easy.
Just enter your income and expenses, refresh the dashboard, and instantly get valuable insights about your spending patterns.
You’ll know:
✅ Where your money is going
✅ Which category costs the most
✅ Which month had the highest expenses
✅ Your top expenses
✅ Your current financial position
Sometimes, better financial decisions start with better visibility.
And that’s exactly what this tracker provides.
Want This Expense Tracker?
Trending Dashboards
I Built a Complete Excel Dashboard in 60 Seconds! Using VBA — Here’s How It Changed My Workflow
How to Create an Interactive Excel Sales Dashboard from Raw Data (Step-by-Step Guide-2026)
Project INSPECT: School Infrastructure Monitoring System & Dashboard 2026

