
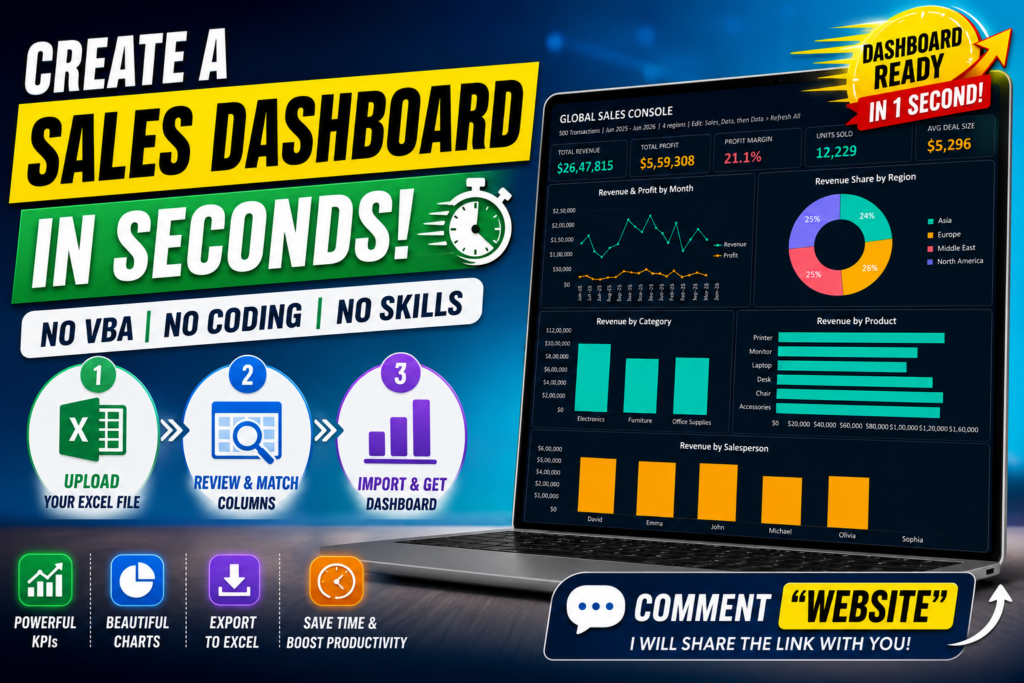

Professional Sales Dashboard in Seconds:- Turn your Excel sales data into a beautiful, interactive dashboard in seconds. No VBA, no formulas, no Power Query—just upload your file and let the dashboard do the rest.
Tired of Spending Hours Creating Excel Dashboards?
Building a professional Excel dashboard from scratch isn’t easy. Most dashboards require advanced formulas, Pivot Tables, Power Query, VBA, and hours of formatting before they look presentation-ready.
Whether you’re a business owner, sales manager, accountant, financial analyst, freelancer, or student, creating dashboards manually can be frustrating and time-consuming.
Now imagine if you could create a professional sales dashboard in just a few seconds.
That’s exactly what our Sales Console Dashboard Generator is designed to do.
Instead of spending hours creating charts and KPIs, simply upload your Excel file and let the tool automatically generate a professional dashboard for you.
👉 Try it here:
https://us.seoanalyser.in/dashboard/sales-console/
Why Use the Sales Console Dashboard?
The Sales Console Dashboard helps you transform raw Excel data into meaningful business insights without writing a single line of VBA code.
Whether your goal is to analyze revenue, monitor profits, track sales performance, or prepare management reports, everything is generated automatically.
No coding.
No formulas.
No dashboard design experience.
Just upload your Excel file and your dashboard is ready.
Create Your Dashboard in 3 Simple Steps
Step 1 – Upload Your Excel File
Start by uploading your sales data.
Simply prepare your Excel sheet using the predefined column format required by the dashboard.
Once uploaded, the system automatically reads your data.
Step 2 – Review Your Data
Before importing, you’ll see a preview of your uploaded data.
This allows you to verify that:
- All required columns are present
- Your data is mapped correctly
- Everything is ready for dashboard creation
If everything looks good, simply click Import into Dashboard.
Step 3 – Your Dashboard Is Ready
Within just a few seconds, your Excel data is transformed into a beautiful, professional dashboard.
No manual formatting.
No chart creation.
No Pivot Tables.
No VBA.
Everything is generated automatically.
Powerful Dashboard Features
The Sales Console Dashboard includes everything you need to monitor your business performance.
Executive KPI Cards
Instantly monitor important business metrics including:
- Total Revenue
- Total Profit
- Profit Margin
- Units Sold
- Average Deal Size
These KPI cards provide an executive summary of your business at a glance.
Revenue & Profit Trend
Visualize monthly revenue and profit using interactive line charts.
Quickly identify:
- Growth trends
- Seasonal performance
- Profit fluctuations
- Business performance over time
Revenue Share by Region
Understand which regions contribute the highest revenue using an attractive donut chart.
Perfect for businesses operating across multiple regions.
Revenue by Category
Analyze which product categories generate the highest sales.
Ideal for:
- Product planning
- Marketing decisions
- Inventory management
Revenue by Product
Compare product performance with clean horizontal bar charts.
Instantly identify:
- Top-selling products
- Low-performing products
- Revenue opportunities
Revenue by Salesperson
Evaluate individual sales performance with visual comparisons.
Perfect for:
- Sales managers
- Team leaders
- Performance reviews
- Incentive planning
Export Dashboard to Excel
One of the biggest advantages of this dashboard is that you can export the complete dashboard back into Excel.
After creating your dashboard, simply click Export.
Your downloaded workbook includes the professionally designed dashboard, allowing you to:
- Share reports with clients
- Present to management
- Print reports
- Continue working in Excel
- Save reports for future analysis
Who Can Use This Dashboard?
The Sales Console Dashboard is perfect for:
- Business Owners
- Sales Managers
- Financial Analysts
- Accountants
- Consultants
- Freelancers
- Startups
- Small Businesses
- Corporate Teams
- Students learning Excel
- Operations Managers
Benefits of Using an Automatic Dashboard Generator
Using this dashboard can help you:
✅ Save hours of manual work
✅ Eliminate repetitive reporting
✅ Build professional dashboards instantly
✅ Improve business reporting
✅ Visualize sales performance
✅ Export reports anytime
✅ Share dashboards with clients
✅ Avoid VBA completely
Why Choose Our Dashboard Instead of Traditional Excel Templates?
Traditional Excel dashboard templates often require significant customization before they become useful.
Our Sales Console Dashboard Generator is different.
It automatically creates a clean, modern dashboard based on your uploaded data.
You don’t need to:
- Learn VBA
- Create Pivot Tables
- Build formulas
- Format charts
- Design layouts
Simply upload your data and let the system handle everything.
Frequently Asked Questions
Do I need VBA knowledge?
No.
The dashboard works without VBA.
Do I need advanced Excel skills?
Not at all.
If you know how to upload an Excel file, you can use this dashboard.
Can I export the dashboard?
Yes.
You can download the completed dashboard as an Excel workbook.
Is this suitable for businesses?
Absolutely.
The dashboard is designed for professionals, business owners, sales teams, accountants, and financial analysts.
Can I use my own Excel data?
Yes.
Simply upload your Excel file using the required column structure, and the dashboard will automatically generate your reports.
Start Creating Your Dashboard Today
Why spend hours creating Excel dashboards manually when you can generate one in seconds?
Upload your Excel data, import it into the dashboard, and instantly create professional reports that are ready to share.
👉 Try the Sales Console Dashboard now:
https://us.seoanalyser.in/dashboard/sales-console/
Final Thoughts
Excel remains one of the world’s most powerful business tools, but creating dashboards manually shouldn’t consume your valuable time.
With the Sales Console Dashboard Generator, you can transform raw sales data into interactive visual reports within seconds—without writing VBA, designing charts, or building complex formulas.
Whether you’re preparing reports for management, analyzing business performance, or simply looking for a faster way to visualize your data, this tool helps you work smarter, not harder.
If you’re ready to simplify your reporting process and create dashboards like a professional, give the Sales Console Dashboard a try today.


