

Excel Dashboard in 60 Seconds! Imagine opening Excel, clicking a single button, and watching an entire dashboard build itself automatically.
No dragging charts.
No creating PivotTables manually.
No formatting headaches.
No hours of repetitive work.
Just one click.
That is exactly what happened when I created an automated Excel VBA dashboard generator that transforms raw expense data into a professional management dashboard in less than 60 seconds.
And honestly, the first time I watched it run, it felt like magic.
Why Most Excel Dashboards Take Too Long
Dashboard in 60 Seconds! If you’ve ever built an Excel dashboard manually, you already know the pain.
The typical process looks something like this:
- Clean the data
- Create an Excel Table
- Build PivotTables
- Create charts
- Format visuals
- Add KPI cards
- Insert slicers
- Align everything perfectly
Even experienced Excel users can spend anywhere from 2 to 6 hours building a polished dashboard.
Now imagine doing that every week or every month.
That’s exactly the problem I wanted to solve.
The Challenge
A manager sends you a new expense report.
You need to create:
- Department-wise spending analysis
- Category breakdown
- Monthly spending trends
- Budget vs Actual comparison
- Payment method analysis
- Approval status reporting
Normally, this means rebuilding reports repeatedly.
Instead, I decided to automate the entire process using Excel VBA.
What Happens When the VBA Runs?
The moment the macro starts, Excel begins building the dashboard automatically.
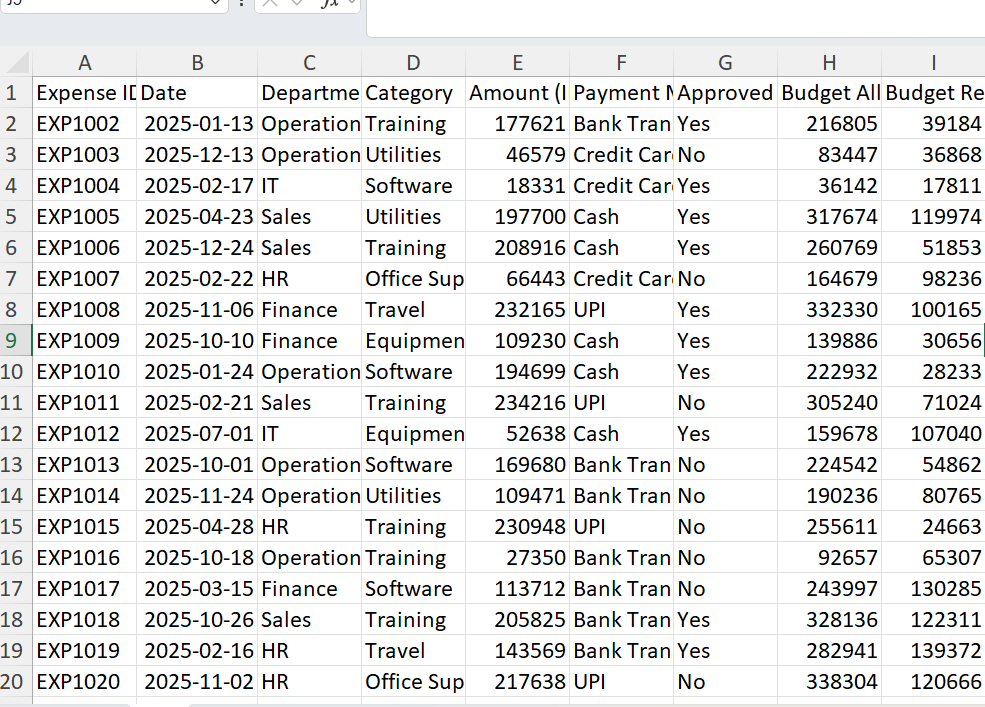
Step 1: Data Validation
The VBA first checks whether required columns exist.
It verifies fields such as:
- Expense ID
- Date
- Department
- Category
- Amount
- Payment Method
- Budget Allocated
- Budget Remaining
If anything is missing, the process stops and displays an error message.
This prevents broken dashboards and inaccurate reports.
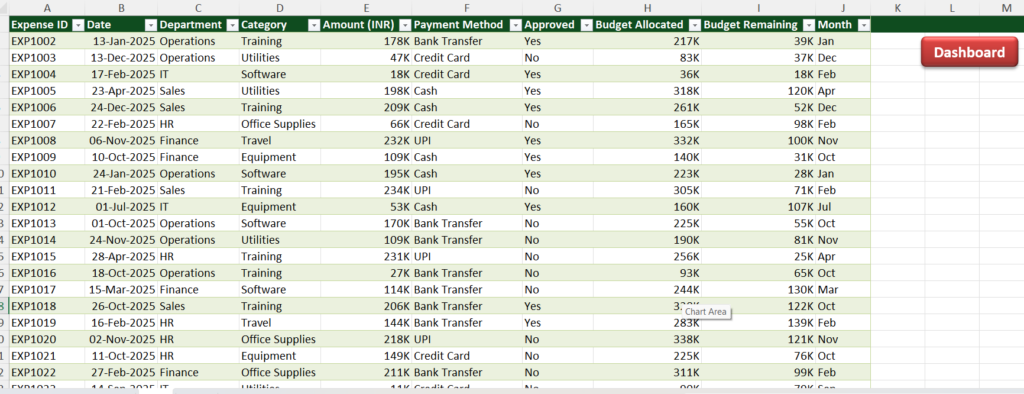
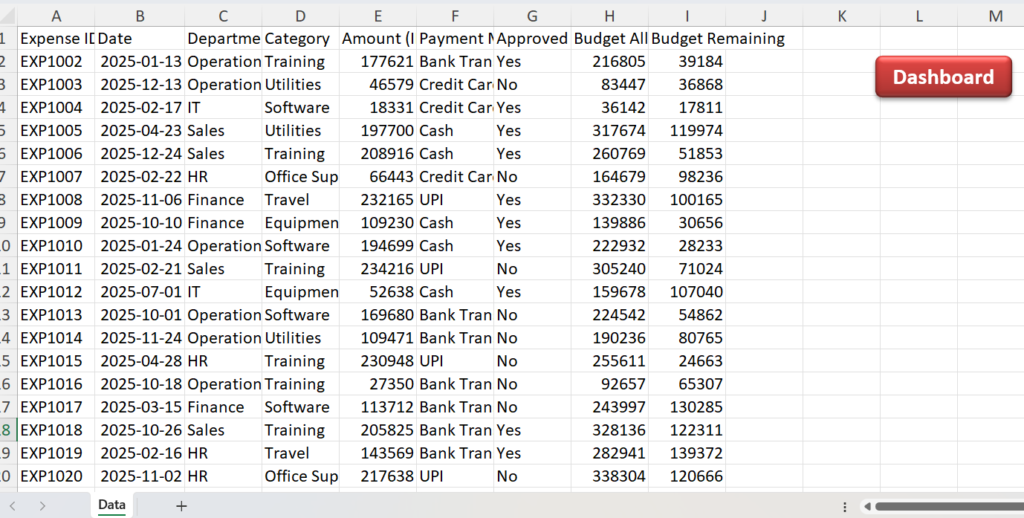
Step 2: Automatic Data Preparation
The code automatically:
- Creates an Excel Table
- Formats dates
- Formats currency values
- Applies professional table styling
- Generates a Month column automatically
This eliminates one of the most time-consuming parts of dashboard creation.
Step 3: PivotTables Are Created Instantly
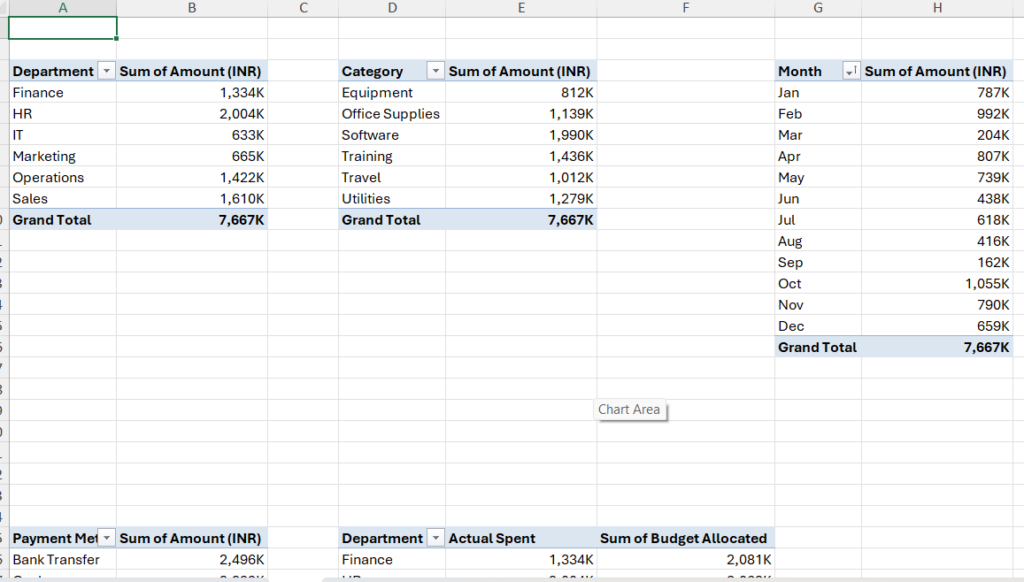
The VBA then generates multiple PivotTables automatically.
These include:
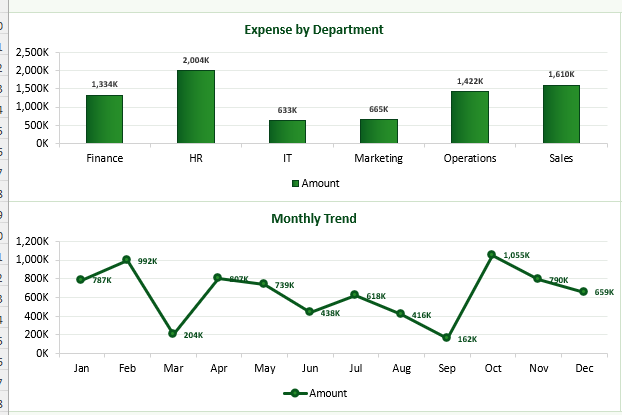
Expense by Department
Shows where company spending is concentrated.
Expense by Category
Identifies major expense categories.
Monthly Expense Trend
Tracks spending patterns over time.
Approval Status
Monitors approved and pending expenses.
KPI Summary
Calculates key metrics automatically.
Payment Method Analysis
Highlights how payments are being made.
Budget vs Actual
Compares planned spending against actual expenses.
Instead of manually creating seven PivotTables, the VBA completes everything in seconds.
The Dashboard Builds Itself
This is where the real magic happens.
After creating all calculations and PivotTables, the macro automatically creates:
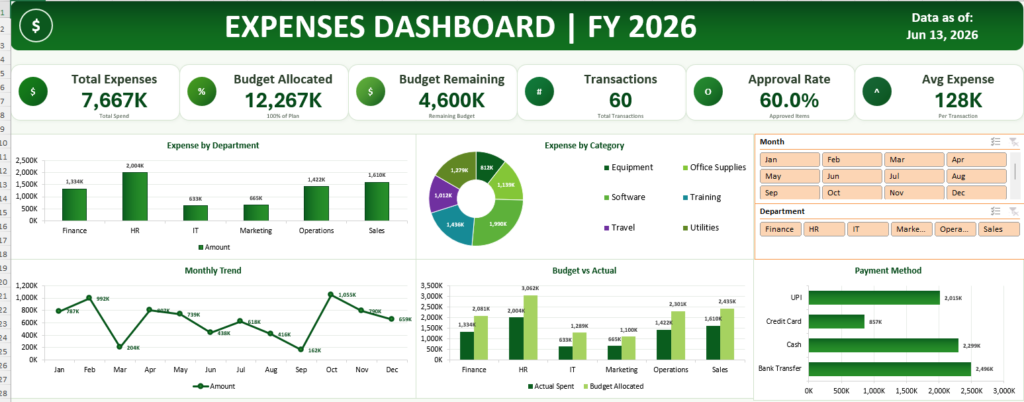
KPI Cards
The dashboard generates professional KPI cards showing:

- Total Expenses
- Budget Allocated
- Budget Remaining
- Number of Transactions
- Approval Rate
- Average Expense
These update automatically whenever data changes.
Professional Charts
The dashboard includes:
- Department Expense Chart
- Category Doughnut Chart
- Monthly Trend Line Chart
- Budget vs Actual Comparison Chart
- Payment Method Analysis Chart
Every chart is formatted automatically with professional styling.
No manual chart editing required.
Interactive Slicers Included
One feature that makes dashboards feel truly professional is interactivity.
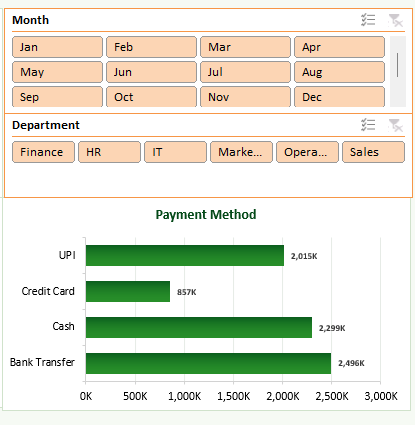
The VBA automatically creates slicers for:
Month Filter
Users can instantly filter reports by month.
Department Filter
Managers can focus on specific departments with a single click.
Every chart and KPI updates automatically.
This creates a dashboard experience similar to expensive business intelligence tools.
Why This Matters for Businesses
Many organizations still spend hours creating reports manually.
The real cost isn’t just time.
It’s consistency.
When dashboards are built manually:
- Formatting varies
- Errors occur
- Reports become unreliable
Automation solves all three problems.
Every dashboard generated by the VBA follows the same structure, design, and calculations.
This improves accuracy while saving countless hours.
The Biggest Benefit: Scalability
Let’s say your company receives:
- Monthly reports
- Weekly expense updates
- Departmental spending reports
Without automation, workload grows with data.
With VBA automation, workload stays almost the same.
Whether you have:
- 500 records
- 5,000 records
- 50,000 records
The dashboard generation process remains nearly identical.
That’s the true power of automation.
Dashboard Download Section (VBA Code)
Option Explicit

Private Const DATA_SHEET     As String = "Data"
Private Const PIVOT_SHEET    As String = "Pivot"
Private Const DASH_SHEET     As String = "Dashboard"
Private Const TABLE_NAME     As String = "tblExpenses"
Private Const MONEY_K_FORMAT As String = "#,##0,""K"""

Private BuildStep As String

'==========================================================
' SECTION 1 — Progress Helpers
'==========================================================
Private Sub ShowProgress(ByVal msg As String, _
                         Optional ByVal flashSheet As String = "", _
                         Optional ByVal pauseMs As Long = 350)
    Application.StatusBar = "  ?  " & msg
    DoEvents
    If flashSheet <> "" Then
        On Error Resume Next
        ThisWorkbook.Worksheets(flashSheet).Activate
        DoEvents
        On Error GoTo 0
    End If
    If pauseMs > 0 Then Wait pauseMs
End Sub

Private Sub Wait(ByVal ms As Long)
    Dim t As Single
    t = Timer
    Do While (Timer - t) * 1000 < ms
        DoEvents
    Loop
End Sub

'==========================================================
' SECTION 2 — Public Entry Point
'==========================================================
Public Sub BuildExpensesDashboard()
    On Error GoTo CleanFail

    BuildStep = "Starting"
    Application.ScreenUpdating = True
    Application.DisplayAlerts = False
    Application.EnableEvents = False
    Application.Calculation = xlCalculationAutomatic

    ShowProgress "Opening Data sheet…", DATA_SHEET, 300

    BuildStep = "Preparing Data"
    ShowProgress "Step 1 of 3 — Formatting Data sheet…", DATA_SHEET, 200
    PrepareDataSheet

    BuildStep = "Building Pivots"
    ShowProgress "Step 2 of 3 — Building PivotTables…", "", 200
    BuildPivotSheet

    BuildStep = "Building Dashboard"
    ShowProgress "Step 3 of 3 — Building Dashboard…", "", 200
    BuildDashboardSheet

    BuildStep = "Final Refresh"
    ShowProgress "Refreshing all data…", DASH_SHEET, 400
    ThisWorkbook.RefreshAll
    Application.CalculateFull
    Application.Calculation = xlCalculationAutomatic

CleanExit:
    Application.StatusBar = False
    Application.EnableEvents = True
    Application.DisplayAlerts = True
    Application.ScreenUpdating = True
    MsgBox "Dashboard Created Successfully", vbInformation, "Done"
    Exit Sub

CleanFail:
    Application.StatusBar = False
    Application.Calculation = xlCalculationAutomatic
    Application.EnableEvents = True
    Application.DisplayAlerts = True
    Application.ScreenUpdating = True
    MsgBox "Dashboard build failed at step: " & BuildStep & vbCrLf & _
           "Error " & Err.Number & ": " & Err.Description, vbCritical
End Sub

'==========================================================
' SECTION 3 — PrepareDataSheet
'==========================================================
Private Sub PrepareDataSheet()
    Dim ws As Worksheet, lo As ListObject, rng As Range
    Dim lastRow As Long, lastCol As Long

    Set ws = ThisWorkbook.Worksheets(DATA_SHEET)
    ws.Activate

    ShowProgress "Checking required columns…", , 250
    RequireHeader ws, "Expense ID"
    RequireHeader ws, "Date"
    RequireHeader ws, "Department"
    RequireHeader ws, "Category"
    RequireHeader ws, "Amount (INR)"
    RequireHeader ws, "Payment Method"
    RequireHeader ws, "Approved"
    RequireHeader ws, "Budget Allocated"
    RequireHeader ws, "Budget Remaining"

    ShowProgress "Inserting Month column…", , 300
    If HeaderColumn(ws, "Month") = 0 Then
        ws.Cells(1, LastUsedCol(ws) + 1).Value = "Month"
    End If

    ShowProgress "Creating Excel Table (tblExpenses)…", , 350
    lastRow = LastUsedRow(ws)
    lastCol = LastUsedCol(ws)
    Set rng = ws.Range(ws.Cells(1, 1), ws.Cells(lastRow, lastCol))

    Dim lo2 As ListObject
    On Error Resume Next
    Set lo2 = ws.ListObjects(TABLE_NAME)
    On Error GoTo 0

    If lo2 Is Nothing Then
        Set lo = ws.ListObjects.Add(xlSrcRange, rng, , xlYes)
        lo.Name = TABLE_NAME
    Else
        Set lo = lo2
        lo.Resize rng
    End If

    lo.TableStyle = "TableStyleMedium4"
    lo.ShowAutoFilterDropDown = True
    DoEvents

    ShowProgress "Writing Month formula in every row…", , 300
    lo.ListColumns("Month").DataBodyRange.Formula = "=TEXT([@Date],""mmm"")"
    DoEvents

    ShowProgress "Formatting Date column…", , 250
    SafeNumberFormat lo.ListColumns("Date").DataBodyRange, "dd-mmm-yyyy"
    DoEvents

    ShowProgress "Formatting Amount (INR) column…", , 250
    SafeNumberFormat lo.ListColumns("Amount (INR)").DataBodyRange, MONEY_K_FORMAT
    DoEvents

    ShowProgress "Formatting Budget Allocated column…", , 250
    SafeNumberFormat lo.ListColumns("Budget Allocated").DataBodyRange, MONEY_K_FORMAT
    DoEvents

    ShowProgress "Formatting Budget Remaining column…", , 250
    SafeNumberFormat lo.ListColumns("Budget Remaining").DataBodyRange, MONEY_K_FORMAT
    DoEvents

    ShowProgress "Styling header row…", , 300
    With ws.Rows(1)
        .Font.Bold = True
        .Interior.Color = RGB(15, 76, 31)
        .Font.Color = RGB(255, 255, 255)
    End With
    DoEvents

    ShowProgress "Auto-fitting column widths…", , 250
    ws.Columns.AutoFit
    DoEvents
End Sub

'==========================================================
' SECTION 4 — BuildPivotSheet
'==========================================================
Private Sub BuildPivotSheet()
    Dim wsP As Worksheet, lo As ListObject, pc As PivotCache

    ShowProgress "Removing old sheets…", , 300
    DeleteSheetIfExists DASH_SHEET
    DeleteSheetIfExists PIVOT_SHEET

    ShowProgress "Creating Pivot sheet…", , 300
    Set wsP = ThisWorkbook.Worksheets.Add(After:=ThisWorkbook.Worksheets(DATA_SHEET))
    wsP.Name = PIVOT_SHEET
    wsP.Activate
    DoEvents

    Set lo = ThisWorkbook.Worksheets(DATA_SHEET).ListObjects(TABLE_NAME)

    Set pc = ThisWorkbook.PivotCaches.Create( _
        SourceType:=xlDatabase, _
        SourceData:=lo.Range.Address(True, True, xlR1C1, True))

    ShowProgress "Building PivotTable 1/7 — Expense by Department…", PIVOT_SHEET, 400
    CreatePivot_ExpenseByDepartment pc, wsP.Range("A3")
    DoEvents

    ShowProgress "Building PivotTable 2/7 — Expense by Category…", PIVOT_SHEET, 400
    CreatePivot_ExpenseByCategory pc, wsP.Range("D3")
    DoEvents

    ShowProgress "Building PivotTable 3/7 — Monthly Trend…", PIVOT_SHEET, 400
    CreatePivot_MonthlyTrend pc, wsP.Range("G3")
    DoEvents

    ShowProgress "Building PivotTable 4/7 — Approved Status…", PIVOT_SHEET, 400
    CreatePivot_ApprovedStatus pc, wsP.Range("J3")
    DoEvents

    ShowProgress "Building PivotTable 5/7 — KPI Totals…", PIVOT_SHEET, 400
    CreatePivot_KPI pc, wsP.Range("M3")
    DoEvents

    ShowProgress "Building PivotTable 6/7 — Payment Method…", PIVOT_SHEET, 400
    CreatePivot_PaymentMethod pc, wsP.Range("A25")
    DoEvents

    ShowProgress "Building PivotTable 7/7 — Budget vs Actual…", PIVOT_SHEET, 400
    CreatePivot_BudgetVsActual pc, wsP.Range("D25")
    DoEvents

    ShowProgress "Generating chart-helper data ranges…", PIVOT_SHEET, 350
    BuildChartHelpers wsP
    DoEvents

    wsP.Columns.AutoFit
End Sub

'==========================================================
' SECTION 5 — Seven PivotTable Builders
'==========================================================
Private Sub CreatePivot_ExpenseByDepartment(ByVal pc As PivotCache, ByVal dest As Range)
    Dim pt As PivotTable
    Set pt = pc.CreatePivotTable(TableDestination:=dest, TableName:="PT_ExpenseByDepartment")
    With pt
        .PivotFields("Department").Orientation = xlRowField
        .AddDataField .PivotFields("Amount (INR)"), "Sum of Amount (INR)", xlSum
        .RowAxisLayout xlTabularRow
        .RefreshTable
    End With
    FormatPivotValues pt, MONEY_K_FORMAT
End Sub

Private Sub CreatePivot_ExpenseByCategory(ByVal pc As PivotCache, ByVal dest As Range)
    Dim pt As PivotTable
    Set pt = pc.CreatePivotTable(TableDestination:=dest, TableName:="PT_ExpenseByCategory")
    With pt
        .PivotFields("Category").Orientation = xlRowField
        .AddDataField .PivotFields("Amount (INR)"), "Sum of Amount (INR)", xlSum
        .RowAxisLayout xlTabularRow
        .RefreshTable
    End With
    FormatPivotValues pt, MONEY_K_FORMAT
End Sub

Private Sub CreatePivot_MonthlyTrend(ByVal pc As PivotCache, ByVal dest As Range)
    Dim pt As PivotTable
    Set pt = pc.CreatePivotTable(TableDestination:=dest, TableName:="PT_MonthlyTrend")
    With pt
        .PivotFields("Month").Orientation = xlRowField
        .AddDataField .PivotFields("Amount (INR)"), "Sum of Amount (INR)", xlSum
        .PivotFields("Month").AutoSort xlAscending, "Month"
        .RowAxisLayout xlTabularRow
        .RefreshTable
    End With
    FormatPivotValues pt, MONEY_K_FORMAT
End Sub

Private Sub CreatePivot_ApprovedStatus(ByVal pc As PivotCache, ByVal dest As Range)
    Dim pt As PivotTable
    Set pt = pc.CreatePivotTable(TableDestination:=dest, TableName:="PT_ApprovedStatus")
    With pt
        .PivotFields("Approved").Orientation = xlRowField
        .AddDataField .PivotFields("Amount (INR)"), "Sum of Amount (INR)", xlSum
        .AddDataField .PivotFields("Expense ID"), "Count of Expense ID", xlCount
        .RowAxisLayout xlTabularRow
        .RefreshTable
    End With
    On Error Resume Next
    pt.DataFields(1).DataRange.NumberFormat = MONEY_K_FORMAT
    pt.DataFields(2).DataRange.NumberFormat = "#,##0"
    On Error GoTo 0
End Sub

Private Sub CreatePivot_KPI(ByVal pc As PivotCache, ByVal dest As Range)
    Dim pt As PivotTable
    Set pt = pc.CreatePivotTable(TableDestination:=dest, TableName:="PT_KPI")
    With pt
        .AddDataField .PivotFields("Amount (INR)"), "Sum of Amount (INR)", xlSum
        .AddDataField .PivotFields("Budget Allocated"), "Sum of Budget Allocated", xlSum
        .AddDataField .PivotFields("Budget Remaining"), "Sum of Budget Remaining", xlSum
        .AddDataField .PivotFields("Expense ID"), "Count of Expense ID", xlCount
        .RefreshTable
    End With
    FormatPivotValues pt, MONEY_K_FORMAT
End Sub

Private Sub CreatePivot_PaymentMethod(ByVal pc As PivotCache, ByVal dest As Range)
    Dim pt As PivotTable
    Set pt = pc.CreatePivotTable(TableDestination:=dest, TableName:="PT_PaymentMethod")
    With pt
        .PivotFields("Payment Method").Orientation = xlRowField
        .AddDataField .PivotFields("Amount (INR)"), "Sum of Amount (INR)", xlSum
        .RowAxisLayout xlTabularRow
        .RefreshTable
    End With
    FormatPivotValues pt, MONEY_K_FORMAT
End Sub

Private Sub CreatePivot_BudgetVsActual(ByVal pc As PivotCache, ByVal dest As Range)
    Dim pt As PivotTable
    Set pt = pc.CreatePivotTable(TableDestination:=dest, TableName:="PT_BudgetVsActual")
    With pt
        .PivotFields("Department").Orientation = xlRowField
        .AddDataField .PivotFields("Amount (INR)"), "Actual Spent", xlSum
        .AddDataField .PivotFields("Budget Allocated"), "Sum of Budget Allocated", xlSum
        .RowAxisLayout xlTabularRow
        .RefreshTable
    End With
    FormatPivotValues pt, MONEY_K_FORMAT
End Sub

'==========================================================
' SECTION 6 — Chart Helper Data Builders
'==========================================================
Private Sub BuildChartHelpers(ByVal ws As Worksheet)
    ws.Range("A50:Z95").ClearContents

    BuildTwoColumnHelper ws, "A50", ws.PivotTables("PT_ExpenseByDepartment"), "Department", "Amount"
    BuildTwoColumnHelper ws, "D50", ws.PivotTables("PT_ExpenseByCategory"), "Category", "Amount"
    BuildTwoColumnHelper ws, "G50", ws.PivotTables("PT_MonthlyTrend"), "Month", "Amount"
    BuildTwoColumnHelper ws, "J50", ws.PivotTables("PT_PaymentMethod"), "Payment Method", "Amount"
    BuildBudgetHelper ws, "M50", ws.PivotTables("PT_BudgetVsActual")
End Sub

Private Sub BuildTwoColumnHelper(ByVal ws As Worksheet, ByVal topLeft As String, _
                                  ByVal pt As PivotTable, ByVal h1 As String, ByVal h2 As String)
    Dim r As Range, i As Long, n As Long
    Set r = ws.Range(topLeft)
    r.Value = h1
    r.Offset(0, 1).Value = h2
    n = PivotDataRowsCount(pt)
    For i = 1 To n
        r.Offset(i, 0).Formula = "=" & pt.RowRange.Cells(i + 1, 1).Address(True, True, xlA1, True)
        r.Offset(i, 1).Formula = "=" & pt.DataBodyRange.Cells(i, 1).Address(True, True, xlA1, True)
    Next i
    SafeNumberFormat r.Offset(1, 1).Resize(n, 1), MONEY_K_FORMAT
End Sub

Private Sub BuildBudgetHelper(ByVal ws As Worksheet, ByVal topLeft As String, ByVal pt As PivotTable)
    Dim r As Range, i As Long, n As Long
    Set r = ws.Range(topLeft)
    r.Value = "Department"
    r.Offset(0, 1).Value = "Actual Spent"
    r.Offset(0, 2).Value = "Budget Allocated"
    n = PivotDataRowsCount(pt)
    For i = 1 To n
        r.Offset(i, 0).Formula = "=" & pt.RowRange.Cells(i + 1, 1).Address(True, True, xlA1, True)
        r.Offset(i, 1).Formula = "=" & pt.DataBodyRange.Cells(i, 1).Address(True, True, xlA1, True)
        r.Offset(i, 2).Formula = "=" & pt.DataBodyRange.Cells(i, 2).Address(True, True, xlA1, True)
    Next i
    SafeNumberFormat r.Offset(1, 1).Resize(n, 2), MONEY_K_FORMAT
End Sub

'==========================================================
' SECTION 7 — BuildDashboardSheet Orchestrator
'==========================================================
Private Sub BuildDashboardSheet()
    Dim wsD As Worksheet

    ShowProgress "Creating Dashboard sheet…", , 300
    DeleteSheetIfExists DASH_SHEET
    Set wsD = ThisWorkbook.Worksheets.Add(Before:=ThisWorkbook.Worksheets(1))
    wsD.Name = DASH_SHEET
    wsD.Activate

    ' -- Set zoom and turn headings ON immediately — before anything is drawn --
    ActiveWindow.Zoom = 70
    ActiveWindow.DisplayHeadings = True
    DoEvents

    ShowProgress "Applying canvas & grid settings…", DASH_SHEET, 300
    ApplyDashboardCanvas wsD
    DoEvents

    ShowProgress "Drawing header banner…", DASH_SHEET, 400
    CreateHeader wsD
    DoEvents

    ShowProgress "Writing KPI helper formulas…", DASH_SHEET, 300
    CreateKPIHelperFormulas wsD
    DoEvents

    ShowProgress "Building KPI cards (6 cards)…", DASH_SHEET, 500
    CreateKPICards wsD
    DoEvents

    ShowProgress "Inserting charts — Department, Category, Trend, Budget, Payment…", DASH_SHEET, 600
    CreateDashboardCharts wsD
    DoEvents

    ShowProgress "Adding Month slicer…", DASH_SHEET, 400
    CreateMonthSlicer wsD
    DoEvents

    ShowProgress "Adding Department slicer…", DASH_SHEET, 400
    CreateDepartmentSlicer wsD
    DoEvents

    ShowProgress "Applying final formatting & print settings…", DASH_SHEET, 350
    FinalDashboardFormatting wsD
    DoEvents

    ' -- Re-activate Dashboard and permanently lock in headings ON at 70% ------
    wsD.Activate
    wsD.Range("A1").Select
    ActiveWindow.Zoom = 70
    ActiveWindow.DisplayHeadings = True   ' final authoritative set — headings stay ON permanently
End Sub

'==========================================================
' SECTION 8 — ApplyDashboardCanvas
'==========================================================
Private Sub ApplyDashboardCanvas(ByVal ws As Worksheet)
    Dim i As Long
    ws.Activate
    ActiveWindow.DisplayGridlines = False
    ' DisplayHeadings is NOT touched here — controlled only in BuildDashboardSheet

    ws.Cells.Interior.Color = RGB(246, 250, 244)
    ws.Cells.Font.Name = "Aptos"
    ws.Cells.Font.Size = 10

    For i = 1 To 30
        ws.Columns(i).ColumnWidth = 7.3
    Next i

    ws.Rows("1:3").RowHeight = 22
    ws.Rows("4:29").RowHeight = 18
End Sub

'==========================================================
' SECTION 9 — CreateHeader
'==========================================================
Private Sub CreateHeader(ByVal ws As Worksheet)
    Dim shp As Shape, icon As Shape, dateBox As Shape, titleBox As Shape

    Dim bannerLeft   As Double: bannerLeft = ws.Range("A1").Left
    Dim bannerTop    As Double: bannerTop = ws.Range("A1").Top
    Dim bannerWidth  As Double: bannerWidth = ws.Range("A1:AD3").Width
    Dim bannerHeight As Double: bannerHeight = ws.Range("A1:AD3").Height

    Dim iconW    As Double: iconW = 42
    Dim iconH    As Double: iconH = 42
    Dim iconLeft As Double: iconLeft = bannerLeft + 12
    Dim iconTop  As Double: iconTop = bannerTop + (bannerHeight - iconH) / 2

    Dim dateW    As Double: dateW = 190
    Dim dateH    As Double: dateH = bannerHeight - 8
    Dim dateLeft As Double: dateLeft = bannerLeft + bannerWidth - dateW - 10
    Dim dateTop  As Double: dateTop = bannerTop + 4

    Dim titleLeft   As Double: titleLeft = iconLeft + iconW + 8
    Dim titleWidth  As Double: titleWidth = dateLeft - titleLeft - 8
    Dim titleTop    As Double: titleTop = bannerTop
    Dim titleHeight As Double: titleHeight = bannerHeight

    ' === Green gradient banner ===
    Set shp = ws.Shapes.AddShape(msoShapeRoundedRectangle, bannerLeft, bannerTop, bannerWidth, bannerHeight)
    With shp
        .Name = "Header_Banner"
        .Fill.TwoColorGradient msoGradientHorizontal, 1
        .Fill.ForeColor.RGB = RGB(6, 66, 25)
        .Fill.BackColor.RGB = RGB(17, 112, 31)
        .Line.Visible = msoFalse
        .TextFrame.Characters.Text = ""
    End With

    ' === Dollar-sign oval icon ===
    Set icon = ws.Shapes.AddShape(msoShapeOval, iconLeft, iconTop, iconW, iconH)
    With icon
        .Fill.ForeColor.RGB = RGB(12, 88, 30)
        .Line.ForeColor.RGB = RGB(230, 245, 230)
        .TextFrame.Characters.Text = "$"
        .TextFrame.HorizontalAlignment = xlHAlignCenter
        .TextFrame.VerticalAlignment = xlVAlignCenter
        .TextFrame.Characters.Font.Color = RGB(255, 255, 255)
        .TextFrame.Characters.Font.Bold = True
        .TextFrame.Characters.Font.Size = 22
    End With

    ' === Title textbox (centre) ===
    Set titleBox = ws.Shapes.AddTextbox(msoTextOrientationHorizontal, _
        titleLeft, titleTop, titleWidth, titleHeight)
    With titleBox
        .Fill.Visible = msoFalse
        .Line.Visible = msoFalse
        .TextFrame2.WordWrap = msoFalse
        .TextFrame2.AutoSize = msoAutoSizeNone
        .TextFrame.Characters.Text = "EXPENSES DASHBOARD | FY 2026"
        .TextFrame.HorizontalAlignment = xlHAlignCenter
        .TextFrame.VerticalAlignment = xlVAlignCenter
        .TextFrame.Characters.Font.Color = RGB(255, 255, 255)
        .TextFrame.Characters.Font.Bold = True
        .TextFrame.Characters.Font.Size = 44
    End With

    ' === Date textbox (right) ===
    Set dateBox = ws.Shapes.AddTextbox(msoTextOrientationHorizontal, _
        dateLeft, dateTop, dateW, dateH)
    With dateBox
        .Fill.Visible = msoFalse
        .Line.Visible = msoFalse
        .TextFrame2.WordWrap = msoTrue
        .TextFrame2.AutoSize = msoAutoSizeNone
        .TextFrame.Characters.Text = "Data as of:" & vbCrLf & Format(Date, "mmm dd, yyyy")
        .TextFrame.HorizontalAlignment = xlHAlignCenter
        .TextFrame.VerticalAlignment = xlVAlignCenter
        .TextFrame.Characters.Font.Color = RGB(255, 255, 255)
        .TextFrame.Characters.Font.Bold = True
        .TextFrame.Characters.Font.Size = 18
    End With
End Sub

'==========================================================
' SECTION 10 — KPI Helper Formulas
'==========================================================
Private Sub CreateKPIHelperFormulas(ByVal ws As Worksheet)
    ws.Range("AF1:AG20").ClearContents

    ws.Range("AF2").Formula = "=IFERROR(GETPIVOTDATA(""Sum of Amount (INR)"",Pivot!$M$3),0)"
    ws.Range("AF3").Formula = "=IFERROR(GETPIVOTDATA(""Sum of Budget Allocated"",Pivot!$M$3),0)"
    ws.Range("AF4").Formula = "=IFERROR(GETPIVOTDATA(""Sum of Budget Remaining"",Pivot!$M$3),0)"
    ws.Range("AF5").Formula = "=IFERROR(GETPIVOTDATA(""Count of Expense ID"",Pivot!$M$3),0)"
    ws.Range("AF6").Formula = "=IFERROR(GETPIVOTDATA(""Count of Expense ID"",Pivot!$J$3,""Approved"",""Yes"")/AF5,0)"
    ws.Range("AF7").Formula = "=IFERROR(AF2/AF5,0)"

    SafeNumberFormat ws.Range("AF2:AF4,AF7"), MONEY_K_FORMAT
    SafeNumberFormat ws.Range("AF5"), "#,##0"
    SafeNumberFormat ws.Range("AF6"), "0.0%"
End Sub

'==========================================================
' SECTION 11 — KPI Cards
'==========================================================
Private Sub CreateKPICards(ByVal ws As Worksheet)
    ShowProgress "  KPI card 1/6 — Total Expenses…", DASH_SHEET, 300
    AddKPICard ws, "A5:E8", "Total Expenses", "=Dashboard!$AF$2", "$", "Total Spend", RGB(21, 125, 24)
    DoEvents
    ShowProgress "  KPI card 2/6 — Budget Allocated…", DASH_SHEET, 300
    AddKPICard ws, "F5:J8", "Budget Allocated", "=Dashboard!$AF$3", "%", "100% of Plan", RGB(67, 152, 32)
    DoEvents
    ShowProgress "  KPI card 3/6 — Budget Remaining…", DASH_SHEET, 300
    AddKPICard ws, "K5:O8", "Budget Remaining", "=Dashboard!$AF$4", "$", "Remaining Budget", RGB(93, 171, 57)
    DoEvents
    ShowProgress "  KPI card 4/6 — Transactions…", DASH_SHEET, 300
    AddKPICard ws, "P5:T8", "Transactions", "=Dashboard!$AF$5", "#", "Total Transactions", RGB(17, 121, 58)
    DoEvents
    ShowProgress "  KPI card 5/6 — Approval Rate…", DASH_SHEET, 300
    AddKPICard ws, "U5:Y8", "Approval Rate", "=Dashboard!$AF$6", "O", "Approved Items", RGB(37, 137, 48)
    DoEvents
    ShowProgress "  KPI card 6/6 — Avg Expense…", DASH_SHEET, 300
    AddKPICard ws, "Z5:AD8", "Avg Expense", "=Dashboard!$AF$7", "^", "Per Transaction", RGB(22, 101, 52)
    DoEvents
End Sub

Private Sub AddKPICard(ByVal ws As Worksheet, ByVal addr As String, ByVal title As String, _
                       ByVal valueFormula As String, ByVal iconText As String, _
                       ByVal subTitle As String, ByVal accent As Long)
    Dim box As Range, card As Shape, icon As Shape
    Dim titleBox As Shape, valueBox As Shape, subBox As Shape

    Set box = ws.Range(addr)

    ' White card with soft green border + shadow
    Set card = ws.Shapes.AddShape(msoShapeRoundedRectangle, box.Left, box.Top, box.Width, box.Height)
    With card
        .Fill.ForeColor.RGB = RGB(255, 255, 255)
        .Line.ForeColor.RGB = RGB(208, 226, 203)
        .Line.Weight = 0.75
        On Error Resume Next
        .Shadow.Visible = msoTrue
        .Shadow.ForeColor.RGB = RGB(200, 210, 200)
        .Shadow.Transparency = 0.7
        .Shadow.OffsetX = 1
        .Shadow.OffsetY = 1
        On Error GoTo 0
    End With

    ' Gradient oval icon (38×38, offset 10/16 inside card)
    Set icon = ws.Shapes.AddShape(msoShapeOval, box.Left + 10, box.Top + 16, 38, 38)
    With icon
        .Fill.TwoColorGradient msoGradientDiagonalUp, 1
        .Fill.ForeColor.RGB = accent
        .Fill.BackColor.RGB = RGB(8, 80, 25)
        .Line.Visible = msoFalse
        .TextFrame.Characters.Text = iconText
        .TextFrame.HorizontalAlignment = xlHAlignCenter
        .TextFrame.VerticalAlignment = xlVAlignCenter
        .TextFrame.Characters.Font.Color = RGB(255, 255, 255)
        .TextFrame.Characters.Font.Bold = True
        .TextFrame.Characters.Font.Size = 13
    End With

    ' Title label (offset 54/8, height 22, size 18 bold dark green)
    Set titleBox = ws.Shapes.AddTextbox(msoTextOrientationHorizontal, _
        box.Left + 54, box.Top + 8, box.Width - 58, 22)
    With titleBox
        .Fill.Visible = msoFalse
        .Line.Visible = msoFalse
        .TextFrame.Characters.Text = title
        .TextFrame.HorizontalAlignment = xlHAlignCenter
        .TextFrame.VerticalAlignment = xlVAlignCenter
        .TextFrame.Characters.Font.Bold = True
        .TextFrame.Characters.Font.Size = 18
        .TextFrame.Characters.Font.Color = RGB(45, 65, 45)
    End With

    ' Value textbox — formula-linked, offset 54/29, height 34, size 28 bold deep green
    Set valueBox = ws.Shapes.AddTextbox(msoTextOrientationHorizontal, _
        box.Left + 54, box.Top + 29, box.Width - 58, 34)
    With valueBox
        .Fill.Visible = msoFalse
        .Line.Visible = msoFalse
        .TextFrame.HorizontalAlignment = xlHAlignCenter
        .TextFrame.VerticalAlignment = xlVAlignCenter
        .DrawingObject.Formula = valueFormula
        .TextFrame.Characters.Font.Bold = True
        .TextFrame.Characters.Font.Size = 28
        .TextFrame.Characters.Font.Color = RGB(5, 74, 25)
    End With

    ' Subtitle label (offset 54/58, height 13, size 8, grey)
    Set subBox = ws.Shapes.AddTextbox(msoTextOrientationHorizontal, _
        box.Left + 54, box.Top + 58, box.Width - 58, 13)
    With subBox
        .Fill.Visible = msoFalse
        .Line.Visible = msoFalse
        .TextFrame.Characters.Text = subTitle
        .TextFrame.HorizontalAlignment = xlHAlignCenter
        .TextFrame.Characters.Font.Size = 8
        .TextFrame.Characters.Font.Color = RGB(80, 95, 80)
    End With
End Sub

'==========================================================
' SECTION 12 — Dashboard Charts
'==========================================================
Private Sub CreateDashboardCharts(ByVal ws As Worksheet)
    Dim p As Worksheet
    Set p = ThisWorkbook.Worksheets(PIVOT_SHEET)

    ShowProgress "  Chart 1/5 — Expense by Department…", DASH_SHEET, 450
    AddNormalChart ws, xlColumnClustered, "Expense by Department", p.Range("A50").CurrentRegion, "A10:L18", "dept"
    DoEvents

    ShowProgress "  Chart 2/5 — Expense by Category…", DASH_SHEET, 450
    AddNormalChart ws, xlDoughnut, "Expense by Category", p.Range("D50").CurrentRegion, "M10:V18", "category"
    DoEvents

    ShowProgress "  Chart 3/5 — Monthly Trend…", DASH_SHEET, 450
    AddNormalChart ws, xlLineMarkers, "Monthly Trend", p.Range("G50").CurrentRegion, "A19:L28", "trend"
    DoEvents

    ShowProgress "  Chart 4/5 — Budget vs Actual…", DASH_SHEET, 450
    AddNormalChart ws, xlColumnClustered, "Budget vs Actual", p.Range("M50").CurrentRegion, "M19:V28", "budget"
    DoEvents

    ShowProgress "  Chart 5/5 — Payment Method…", DASH_SHEET, 450
    AddNormalChartFixedCm ws, xlBarClustered, "Payment Method", p.Range("J50").CurrentRegion, "W19:AD28", "payment", 7.18
    DoEvents
End Sub

Private Sub AddNormalChart(ByVal ws As Worksheet, ByVal chartType As XlChartType, ByVal chartTitle As String, _
                            ByVal sourceRange As Range, ByVal targetAddress As String, ByVal chartKind As String)
    Dim box As Range, co As ChartObject
    Set box = ws.Range(targetAddress)
    Set co = ws.ChartObjects.Add(box.Left, box.Top, box.Width, box.Height)
    FormatChart co, chartType, chartTitle, sourceRange, chartKind
End Sub

Private Sub AddNormalChartFixedCm(ByVal ws As Worksheet, ByVal chartType As XlChartType, ByVal chartTitle As String, _
                                   ByVal sourceRange As Range, ByVal targetAddress As String, _
                                   ByVal chartKind As String, ByVal heightCm As Double)
    Dim box As Range, co As ChartObject
    Set box = ws.Range(targetAddress)
    Set co = ws.ChartObjects.Add(box.Left, box.Top, box.Width, Application.CentimetersToPoints(heightCm))
    FormatChart co, chartType, chartTitle, sourceRange, chartKind
End Sub

'==========================================================
' SECTION 13 — FormatChart (Master Chart Formatter)
'==========================================================
Private Sub FormatChart(ByVal co As ChartObject, ByVal chartType As XlChartType, ByVal chartTitle As String, _
                         ByVal sourceRange As Range, ByVal chartKind As String)
    Dim s As Series, i As Long
    Dim colors As Variant

    colors = Array(RGB(10, 93, 30), RGB(132, 198, 55), RGB(93, 177, 58), RGB(22, 138, 150), _
                   RGB(112, 48, 160), RGB(97, 135, 36), RGB(145, 160, 170), RGB(237, 125, 49))

    With co.Chart
        .chartType = chartType
        .SetSourceData Source:=sourceRange
        .PlotVisibleOnly = False
        .HasTitle = True
        .chartTitle.Text = chartTitle

        On Error Resume Next
        .chartTitle.Format.TextFrame2.TextRange.Font.Size = 12
        .chartTitle.Format.TextFrame2.TextRange.Font.Bold = msoTrue
        .chartTitle.Format.TextFrame2.TextRange.Font.Fill.ForeColor.RGB = RGB(5, 74, 25)
        .ChartArea.Format.Fill.ForeColor.RGB = RGB(255, 255, 255)
        .PlotArea.Format.Fill.ForeColor.RGB = RGB(255, 255, 255)
        .ChartArea.Format.Line.ForeColor.RGB = RGB(208, 226, 203)
        .ChartArea.Format.Line.Weight = 0.7
        .HasLegend = True

        If chartKind = "category" Then
            .Legend.Position = xlLegendPositionRight
            .Legend.Font.Size = 12
        ElseIf chartKind = "payment" Then
            .HasLegend = False
        Else
            .Legend.Position = xlLegendPositionBottom
        End If

        If chartKind <> "category" Then
            .Axes(xlValue).TickLabels.NumberFormat = MONEY_K_FORMAT
            .Axes(xlValue).Format.Line.ForeColor.RGB = RGB(210, 210, 210)
            .Axes(xlCategory).Format.Line.ForeColor.RGB = RGB(210, 210, 210)
            .Axes(xlValue).MajorGridlines.Format.Line.ForeColor.RGB = RGB(230, 235, 230)
            .Axes(xlValue).MajorGridlines.Format.Line.Weight = 0.5
        End If

        For Each s In .SeriesCollection
            s.HasDataLabels = True
            s.DataLabels.NumberFormat = MONEY_K_FORMAT
            s.DataLabels.Font.Size = 8
            s.DataLabels.Font.Bold = True
            s.DataLabels.Font.Color = RGB(55, 55, 55)
        Next s

        Select Case chartKind

            Case "dept"
                For Each s In .SeriesCollection
                    s.Format.Fill.TwoColorGradient msoGradientVertical, 1
                    s.Format.Fill.ForeColor.RGB = RGB(10, 93, 30)
                    s.Format.Fill.BackColor.RGB = RGB(39, 142, 41)
                    s.Format.Line.ForeColor.RGB = RGB(6, 66, 25)
                Next s

            Case "category"
                .ChartGroups(1).DoughnutHoleSize = 40
                For Each s In .SeriesCollection
                    For i = 1 To s.Points.Count
                        s.Points(i).Format.Fill.ForeColor.RGB = colors((i - 1) Mod 8)
                        s.Points(i).Format.Line.ForeColor.RGB = RGB(255, 255, 255)
                    Next i
                    s.HasDataLabels = True
                    s.DataLabels.ShowValue = True
                    s.DataLabels.ShowPercentage = False
                    s.DataLabels.ShowCategoryName = False
                    s.DataLabels.Position = xlLabelPositionBestFit
                    s.DataLabels.NumberFormat = MONEY_K_FORMAT
                    s.DataLabels.Font.Size = 8
                    s.DataLabels.Font.Bold = True
                    s.DataLabels.Font.Color = RGB(255, 255, 255)
                Next s
                .PlotArea.Left = .ChartArea.Width * 0.03
                .PlotArea.Top = .ChartArea.Height * 0.12
                .PlotArea.Width = .ChartArea.Width * 0.55
                .PlotArea.Height = .ChartArea.Height * 0.78
                .Legend.Left = 229.614
                .Legend.Width = 206.285
                .Legend.Top = .ChartArea.Height * 0.13
                .Legend.Height = .ChartArea.Height * 0.75

            Case "trend"
                For Each s In .SeriesCollection
                    s.Format.Line.ForeColor.RGB = RGB(8, 88, 28)
                    s.Format.Line.Weight = 2.25
                    s.MarkerStyle = xlMarkerStyleCircle
                    s.MarkerSize = 6
                    s.MarkerForegroundColor = RGB(8, 88, 28)
                    s.MarkerBackgroundColor = RGB(39, 142, 41)
                    s.DataLabels.Font.Color = RGB(5, 74, 25)
                Next s

            Case "budget"
                If .SeriesCollection.Count >= 1 Then .SeriesCollection(1).Format.Fill.ForeColor.RGB = RGB(10, 93, 30)
                If .SeriesCollection.Count >= 2 Then .SeriesCollection(2).Format.Fill.ForeColor.RGB = RGB(166, 210, 96)

            Case "payment"
                On Error Resume Next
                .ChartGroups(1).GapWidth = 70
                On Error GoTo 0
                For Each s In .SeriesCollection
                    s.Format.Fill.TwoColorGradient msoGradientHorizontal, 1
                    s.Format.Fill.ForeColor.RGB = RGB(10, 93, 30)
                    s.Format.Fill.BackColor.RGB = RGB(39, 142, 41)
                    s.DataLabels.Position = xlLabelPositionOutsideEnd
                Next s

        End Select

        On Error GoTo 0
    End With

    If chartKind = "payment" Then
        co.Height = co.Height * 0.8986011428
    End If
End Sub

'==========================================================
' SECTION 14 — Month Slicer
'==========================================================
Private Sub CreateMonthSlicer(ByVal wsD As Worksheet)
    Dim sc As SlicerCache, sl As Slicer, pt As PivotTable
    Dim t As Double, l As Double, w As Double, h As Double

    On Error Resume Next
    ThisWorkbook.SlicerCaches("Slicer_Month").Delete
    On Error GoTo 0

    Set pt = ThisWorkbook.Worksheets(PIVOT_SHEET).PivotTables("PT_ExpenseByDepartment")

    On Error Resume Next
    Set sc = ThisWorkbook.SlicerCaches.Add2(pt, "Month", "Slicer_Month")
    If sc Is Nothing Then Set sc = ThisWorkbook.SlicerCaches.Add(pt, "Month", "Slicer_Month")
    On Error GoTo 0

    If sc Is Nothing Then Exit Sub

    AddPivotToSlicer sc, "PT_ExpenseByDepartment"
    AddPivotToSlicer sc, "PT_ExpenseByCategory"
    AddPivotToSlicer sc, "PT_MonthlyTrend"
    AddPivotToSlicer sc, "PT_ApprovedStatus"
    AddPivotToSlicer sc, "PT_KPI"
    AddPivotToSlicer sc, "PT_PaymentMethod"
    AddPivotToSlicer sc, "PT_BudgetVsActual"

    t = wsD.Range("W10").Top
    l = wsD.Range("W10").Left
    w = wsD.Range("W10:AD14").Width
    h = wsD.Range("W10:AD14").Height

    On Error Resume Next
    Set sl = sc.Slicers.Add(wsD, , "Month", "Month", t, l, w, h)
    If Not sl Is Nothing Then
        sl.Top = t: sl.Left = l: sl.Width = w: sl.Height = h
        sl.NumberOfColumns = 4
        sl.Caption = "Month"
        sl.Style = "SlicerStyleLight6"
        sl.Shape.Fill.ForeColor.RGB = RGB(247, 252, 245)
        sl.Shape.Line.ForeColor.RGB = RGB(184, 215, 176)
    End If
    On Error GoTo 0
End Sub

'==========================================================
' SECTION 15 — Department Slicer
'==========================================================
Private Sub CreateDepartmentSlicer(ByVal wsD As Worksheet)
    Dim sc As SlicerCache, sl As Slicer, pt As PivotTable
    Dim t As Double, l As Double, w As Double, h As Double

    On Error Resume Next
    ThisWorkbook.SlicerCaches("Slicer_Department").Delete
    On Error GoTo 0

    Set pt = ThisWorkbook.Worksheets(PIVOT_SHEET).PivotTables("PT_ExpenseByDepartment")

    On Error Resume Next
    Set sc = ThisWorkbook.SlicerCaches.Add2(pt, "Department", "Slicer_Department")
    If sc Is Nothing Then Set sc = ThisWorkbook.SlicerCaches.Add(pt, "Department", "Slicer_Department")
    On Error GoTo 0

    If sc Is Nothing Then Exit Sub

    AddPivotToSlicer sc, "PT_ExpenseByDepartment"
    AddPivotToSlicer sc, "PT_ExpenseByCategory"
    AddPivotToSlicer sc, "PT_MonthlyTrend"
    AddPivotToSlicer sc, "PT_ApprovedStatus"
    AddPivotToSlicer sc, "PT_KPI"
    AddPivotToSlicer sc, "PT_PaymentMethod"
    AddPivotToSlicer sc, "PT_BudgetVsActual"

    t = wsD.Range("W15").Top
    l = wsD.Range("W15").Left
    w = wsD.Range("W15:AD18").Width
    h = wsD.Range("W15:AD18").Height

    On Error Resume Next
    Set sl = sc.Slicers.Add(wsD, , "Department", "Department", t, l, w, h)
    If Not sl Is Nothing Then
        sl.Top = t: sl.Left = l: sl.Width = w: sl.Height = h
        sl.NumberOfColumns = 6
        sl.Caption = "Department"
        sl.Style = "SlicerStyleLight6"
        sl.Shape.Fill.ForeColor.RGB = RGB(247, 252, 245)
        sl.Shape.Line.ForeColor.RGB = RGB(184, 215, 176)
    End If
    On Error GoTo 0
End Sub

'==========================================================
' SECTION 16 — FinalDashboardFormatting
'==========================================================
Private Sub FinalDashboardFormatting(ByVal ws As Worksheet)
    ws.Range("A1:AD29").Font.Name = "Aptos"
    ws.Range("A1:AD29").VerticalAlignment = xlCenter
    ws.Columns("AF:AG").Hidden = True

    ActiveWindow.DisplayGridlines = False
    ' DisplayHeadings is intentionally NOT set here — see BuildDashboardSheet end

    ws.PageSetup.Zoom = False
    ws.PageSetup.FitToPagesWide = 1
    ws.PageSetup.FitToPagesTall = 1
End Sub

'==========================================================
' SECTION 17 — Shared Utility Functions
'==========================================================
Private Sub AddPivotToSlicer(ByVal sc As SlicerCache, ByVal ptName As String)
    On Error Resume Next
    sc.PivotTables.AddPivotTable ThisWorkbook.Worksheets(PIVOT_SHEET).PivotTables(ptName)
    On Error GoTo 0
End Sub

Private Function PivotDataRowsCount(ByVal pt As PivotTable) As Long
    Dim n As Long
    On Error Resume Next
    n = pt.DataBodyRange.Rows.Count
    On Error GoTo 0
    If n <= 1 Then PivotDataRowsCount = 1 Else PivotDataRowsCount = n - 1
End Function

Private Sub FormatPivotValues(ByVal pt As PivotTable, ByVal fmt As String)
    Dim df As PivotField
    On Error Resume Next
    If Not pt.DataBodyRange Is Nothing Then pt.DataBodyRange.NumberFormat = fmt
    For Each df In pt.DataFields
        If InStr(1, df.Caption, "Count", vbTextCompare) > 0 Then
            df.DataRange.NumberFormat = "#,##0"
        Else
            df.DataRange.NumberFormat = fmt
        End If
    Next df
    pt.TableRange1.Font.Name = "Aptos"
    pt.TableRange1.Font.Size = 10
    On Error GoTo 0
End Sub

Private Sub SafeNumberFormat(ByVal rng As Range, ByVal fmt As String)
    On Error Resume Next
    rng.NumberFormat = fmt
    On Error GoTo 0
End Sub

Private Sub DeleteSheetIfExists(ByVal sheetName As String)
    Dim ws As Worksheet
    On Error Resume Next
    Set ws = ThisWorkbook.Worksheets(sheetName)
    On Error GoTo 0
    If Not ws Is Nothing Then ws.Delete
End Sub

Private Function LastUsedRow(ByVal ws As Worksheet) As Long
    Dim c As Range
    Set c = ws.Cells.Find(What:="*", LookIn:=xlFormulas, SearchOrder:=xlByRows, SearchDirection:=xlPrevious)
    If c Is Nothing Then LastUsedRow = 1 Else LastUsedRow = c.Row
End Function

Private Function LastUsedCol(ByVal ws As Worksheet) As Long
    Dim c As Range
    Set c = ws.Cells.Find(What:="*", LookIn:=xlFormulas, SearchOrder:=xlByColumns, SearchDirection:=xlPrevious)
    If c Is Nothing Then LastUsedCol = 1 Else LastUsedCol = c.Column
End Function

Private Function HeaderColumn(ByVal ws As Worksheet, ByVal headerText As String) As Long
    Dim i As Long, lastCol As Long
    lastCol = LastUsedCol(ws)
    For i = 1 To lastCol
        If LCase$(Trim$(CStr(ws.Cells(1, i).Value))) = LCase$(Trim$(headerText)) Then
            HeaderColumn = i
            Exit Function
        End If
    Next i
    HeaderColumn = 0
End Function

Private Sub RequireHeader(ByVal ws As Worksheet, ByVal headerText As String)
    If HeaderColumn(ws, headerText) = 0 Then
        Err.Raise vbObjectError + 200, , "Missing required column: " & headerText
    End If
End Sub
Raw Data Download
Dashboard in 60 Seconds!
Can Beginners Build Something Like This?
Absolutely.
You don’t need to be a professional developer.
Learning VBA is one of the fastest ways to become dramatically more productive in Excel.
Start by understanding:
- Variables
- Loops
- Worksheets
- Ranges
- PivotTables
- Charts
- User automation
Once these concepts click, you can automate almost any repetitive Excel task.
The Future of Excel Reporting
Artificial Intelligence is transforming productivity, but VBA remains one of the most powerful tools available inside Excel.
Companies still rely heavily on spreadsheets.
The professionals who can automate reporting workflows will continue to have a significant advantage.
Instead of spending hours creating dashboards manually, they spend minutes reviewing insights and making decisions.
That’s a massive difference.
Final Thoughts
Building dashboards manually is no longer the best use of time.
When a complete Excel dashboard can be generated in less than one minute, the focus shifts from creating reports to analyzing them.
This VBA project proved something important:
Automation isn’t about replacing Excel.
It’s about unlocking its full potential.
The next time you’re spending hours creating the same dashboard repeatedly, ask yourself one question:
What if Excel could build it for you?
Because with VBA, it absolutely can.


Pingback: Excel Mastery in 2026: The Complete Guide to Advanced Formulas, VBA, Power Query, Dashboards, and Automation - Excel AI Tools and SEO Guides
Amazing
Thank you so much 🙂
Please can I get the raw data?
please check the link https://us.seoanalyser.in/excel-dashboard-in-60-seconds/#Raw_Data_Download
Pingback: I Built an Automated Inventory Dashboard in Excel VBA That Creates Everything in Just 25 Seconds - Excel AI Tools and SEO Guides
Pingback: Where Does Your Money Go Every Month? This Simple Excel Expense Tracker Has the Answer 2026 - Excel AI Tools and SEO Guides