
How I Converted Raw Excel Data into a Professional Sales Dashboard in Seconds
If you’ve ever built an Excel Sales dashboard from scratch, you already know how frustrating the process can be. Cleaning data, creating PivotTables, building charts, formatting KPI cards, and making everything look professional can easily consume an entire afternoon.
What if you could skip all of that?
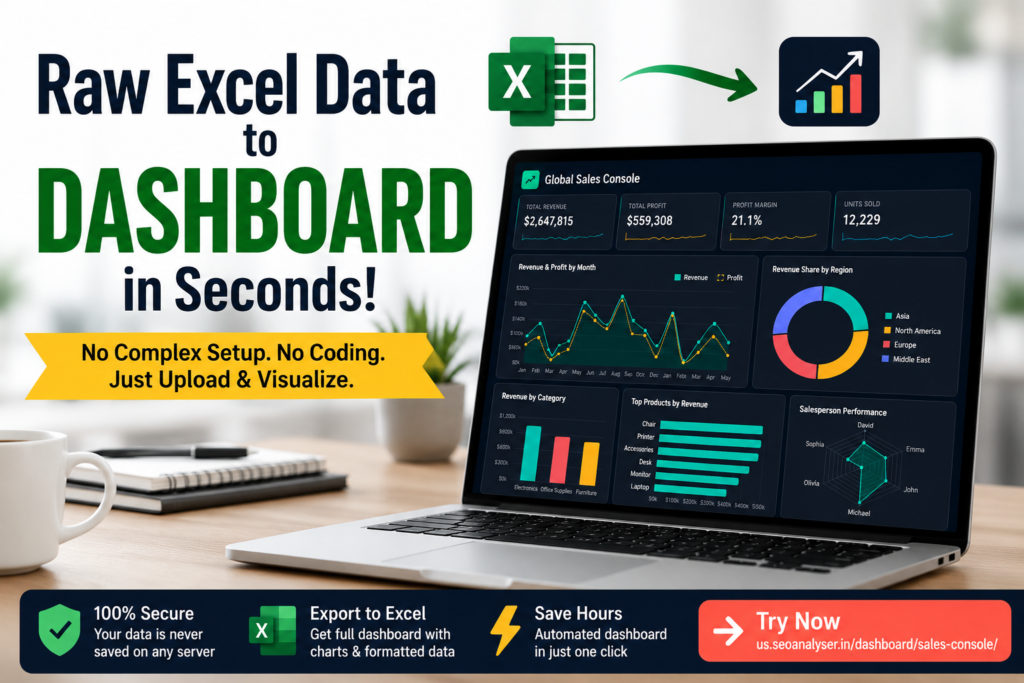
That’s exactly why we built the Sales Console Dashboard. Instead of spending hours designing reports, you simply upload your raw Excel data, preview the mapped columns, click one button, and your dashboard is ready.
Try it here: https://us.seoanalyser.in/dashboard/sales-console/
The Problem Most Excel Users Face
Whether you’re a business analyst, sales manager, accountant, freelancer, or small business owner, you’ve probably experienced this workflow:
- Download raw sales data.
- Remove blank rows and errors.
- Create Pivot Tables.
- Build charts one by one.
- Design KPI cards.
- Repeat everything when new data arrives.
It works—but it isn’t efficient. Most of the time is spent preparing the report instead of analyzing it.
The goal of a dashboard should be helping you make decisions, not wasting hours creating charts.
Our Solution
The Sales Console Dashboard automates the entire reporting process while keeping everything simple enough for beginners.
- Upload your Excel file.

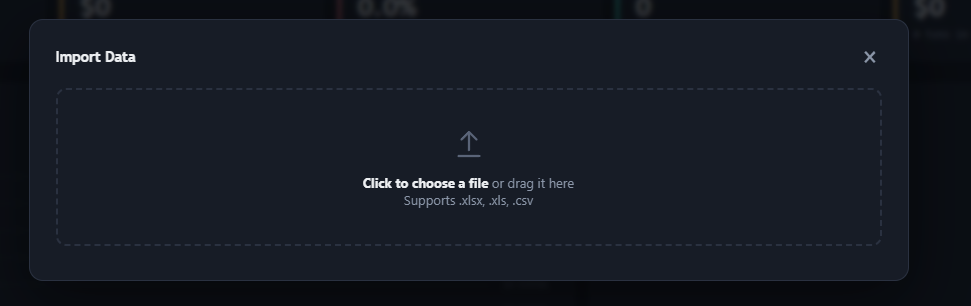
- The dashboard automatically matches your column names with predefined fields.
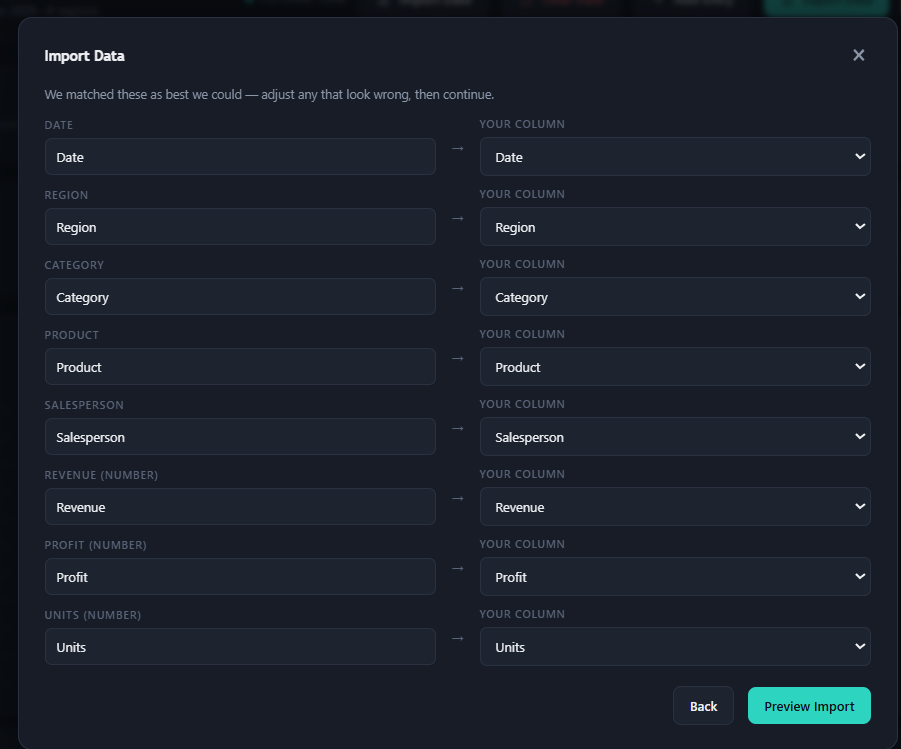
- Preview the imported records.
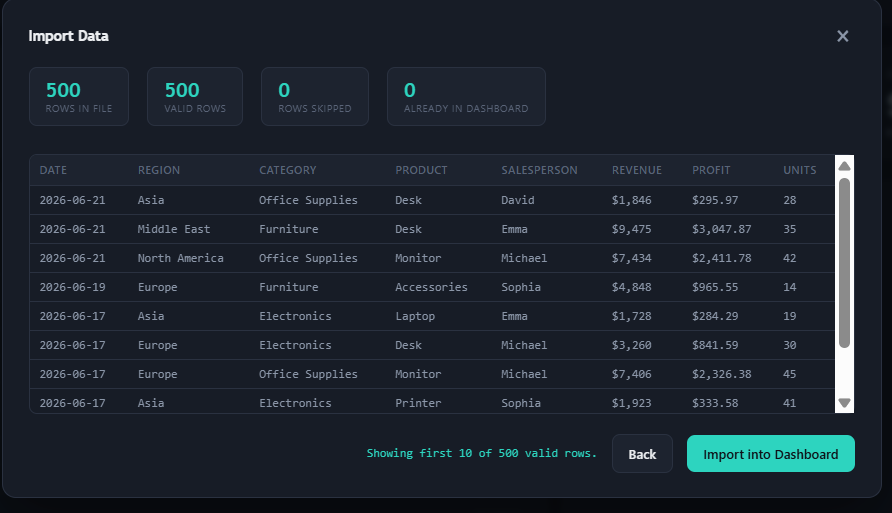
- Click Import into Dashboard.
- That’s it. Your dashboard is generated instantly.
There’s no coding, no formulas, and no complex setup.
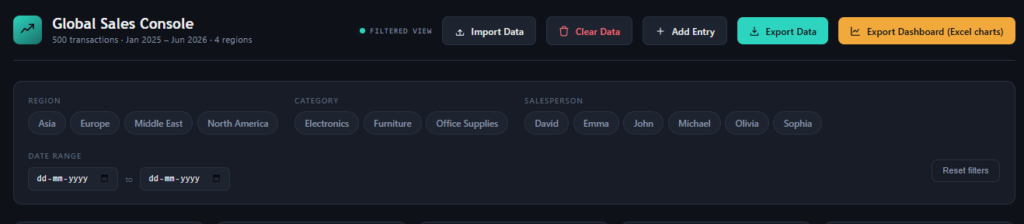
What Makes This Dashboard Different?
- Automatic column mapping
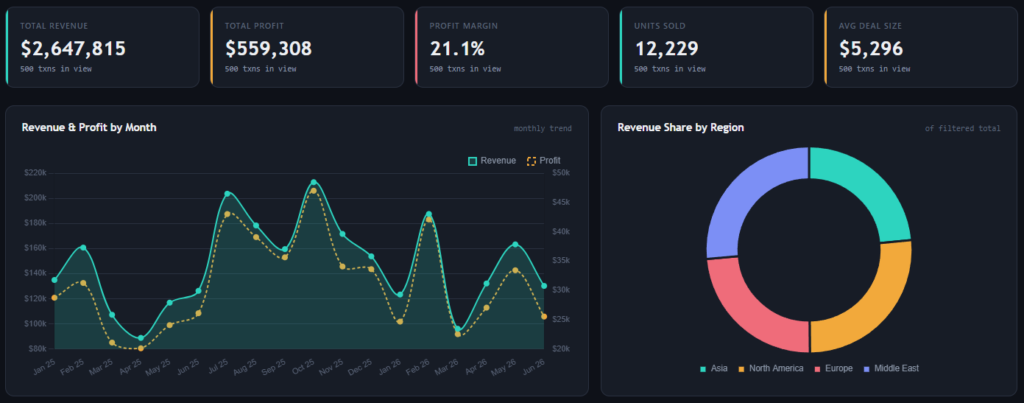
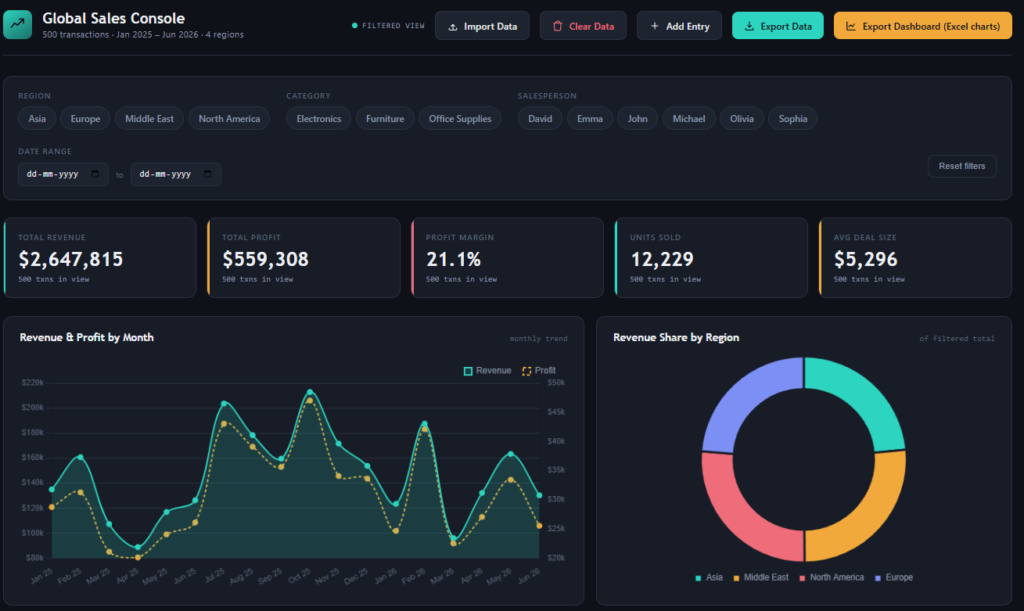
- Interactive KPI cards
- Monthly revenue and profit trends
- Revenue share by region
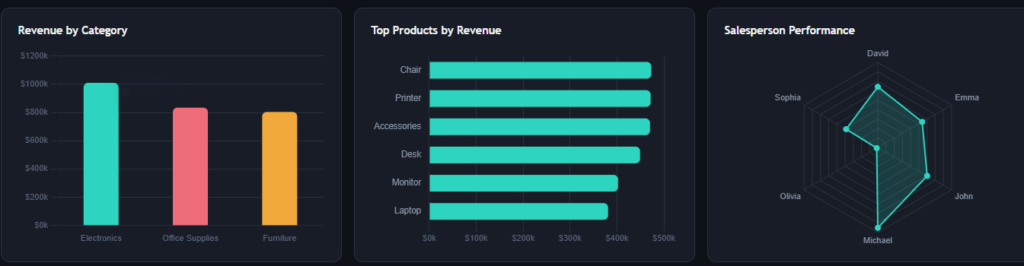
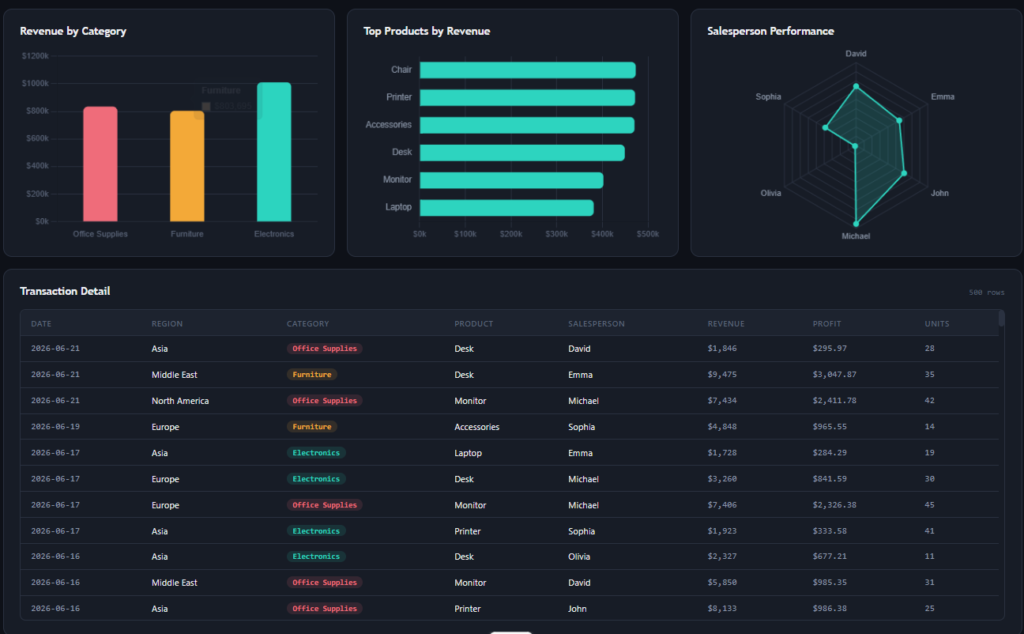
- Category performance analysis
- Top-performing products
- Salesperson performance charts
- Advanced filtering
- Export dashboard to Excel with formatting
- Your data stays under your control
You Don’t Need to Upload Everything Again
One feature our users love is incremental updates. When you receive new sales records, simply add the latest data instead of importing everything from the beginning. The dashboard updates in seconds.
Export Your Dashboard to Excel
Most online dashboard tools stop at visualization. We wanted to go one step further.
With a single click, you can export a beautifully formatted Excel dashboard complete with charts, KPI cards, and structured worksheets. This makes sharing reports with clients or management much easier.
Your Data Remains Private
Privacy matters. That’s why your uploaded information isn’t permanently stored. If you clear the data, it’s removed from the application, helping you stay in control of your business information.
Who Is This Dashboard For?
| User | How It Helps |
|---|---|
| Sales Managers | Track revenue and team performance. |
| Business Analysts | Create reports without manual work. |
| Finance Teams | Monitor revenue and profit trends. |
| Freelancers | Deliver professional dashboards faster. |
| Small Businesses | Understand sales performance instantly. |
Explore More Dashboard Templates
If you enjoy this dashboard, you might also like these resources:
- Build an Excel Dashboard in 60 Seconds
- Professional Excel Sales Dashboard
- Inventory Management Dashboard
Frequently Asked Questions
Can I use my own Excel file?
Yes. As long as your dataset contains the required columns, the dashboard automatically maps them during import.
Do I need advanced Excel skills?
No. The dashboard is designed for both beginners and experienced Excel users.
Can I share the dashboard?
Yes. You can export the dashboard to Excel and share the formatted report with your team or clients.
Ready to Build Your Dashboard?
Instead of spending hours building reports manually, let automation do the heavy lifting.
Launch the Sales Console Dashboard:
https://us.seoanalyser.in/dashboard/sales-console/
