
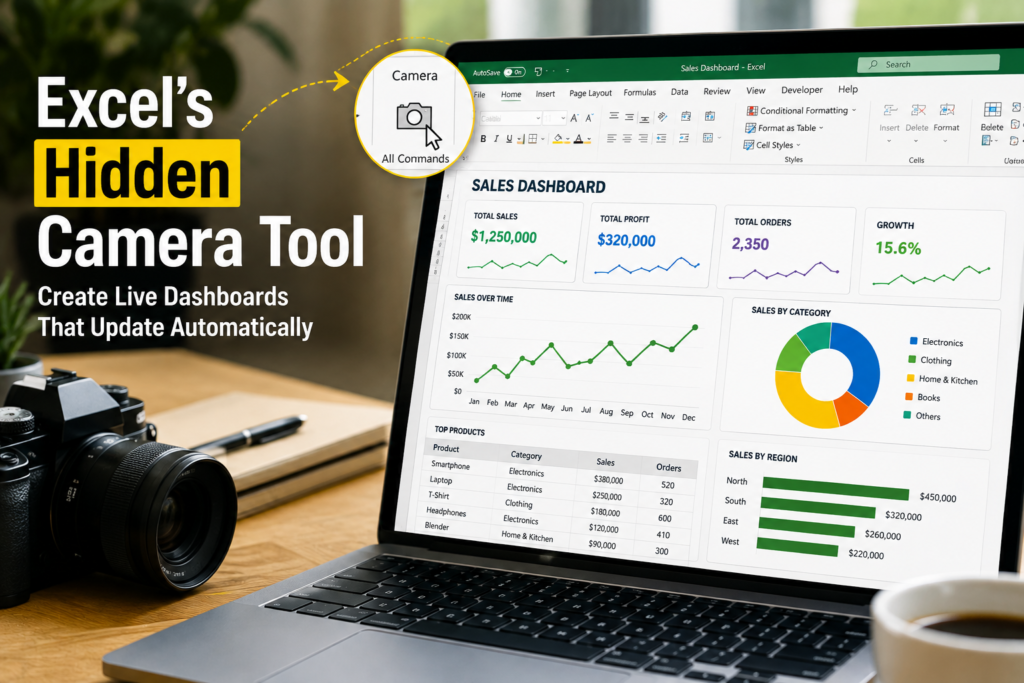

Meta Title: The Hidden Excel Camera Tool for Live Dashboards (Step-by-Step Guide)
Meta Description: Discover Excel’s hidden Camera Tool and learn how to build dynamic dashboards that update automatically. No VBA or Power Query required.
The Hidden Excel Feature That Can Transform Your Dashboards
If you’ve been using Microsoft Excel for years, there’s a good chance you’ve never heard of the Camera Tool.
It’s one of those hidden features that quietly exists inside Excel but can completely change the way you build dashboards and reports.
Imagine creating a dashboard where your KPIs, charts, tables, and summaries automatically update without copying and pasting screenshots every time your data changes. That’s exactly what the Camera Tool does.
Whether you’re preparing reports for your manager, designing executive dashboards, or building interactive business reports, this feature can save hours of repetitive work while making your dashboard look far more professional.
In this guide, I’ll show you exactly what the Excel Camera Tool is, why experienced Excel users love it, and how you can start using it today.
What Is the Excel Camera Tool?
The Excel Camera Tool creates a live picture of any selected range in your workbook.
Unlike taking a screenshot, the image remains connected to the original cells. Whenever the source data changes, the picture updates automatically.
https://us.seoanalyser.in/dashboard
Think of it as creating a smart mirror of your worksheet.
You can use it to display:
- KPI cards
- Financial summaries
- Charts
- Tables
- Pivot Tables
- Conditional formatting
- Entire dashboard sections
The best part?
The formatting remains exactly the same as your original range.
Generate Certificates from Excel Online | Free Certificate Generator
Why Most Excel Users Never Find It
Microsoft doesn’t place the Camera Tool on the Ribbon by default.
Instead, it’s hidden inside Excel’s commands, which means many users work with manual screenshots for years without realizing there’s a better way.
Once you add it to the Quick Access Toolbar, you’ll probably wonder why you didn’t start using it sooner.
How to Enable the Camera Tool
Setting it up only takes a minute.
Step 1
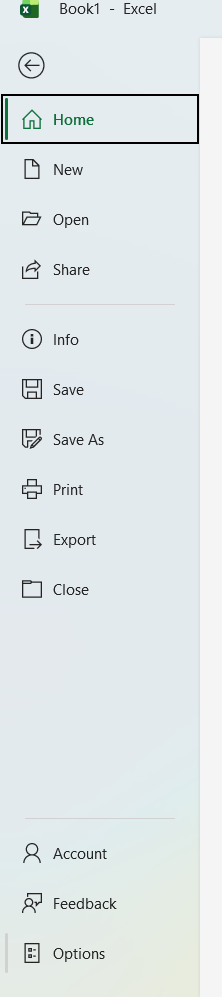
Open File → Options
Step 2
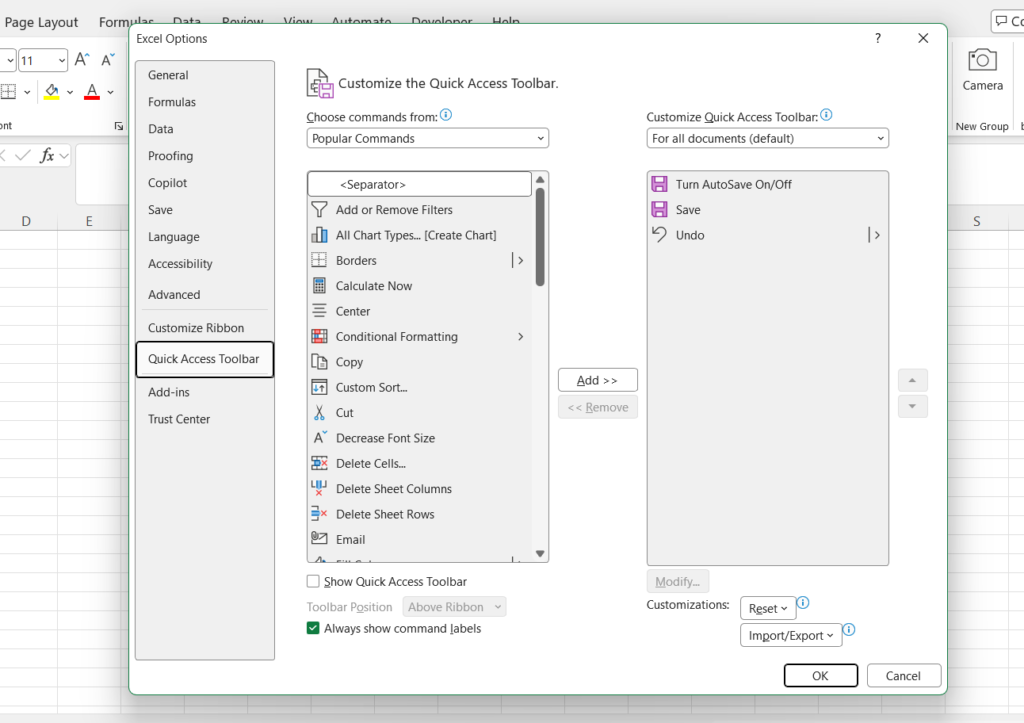
Choose Quick Access Toolbar
Step 3
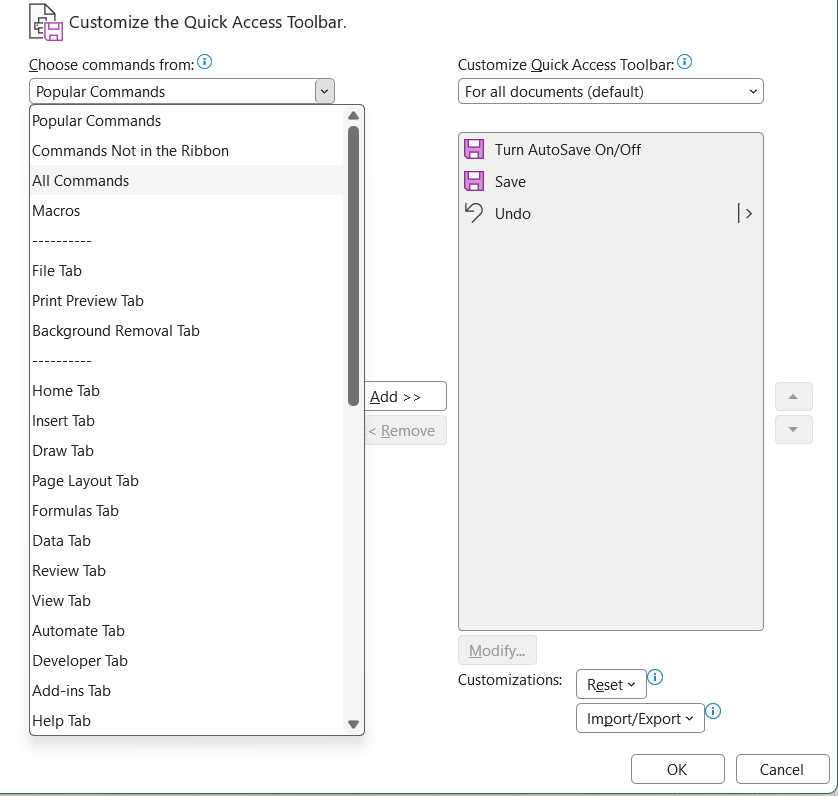
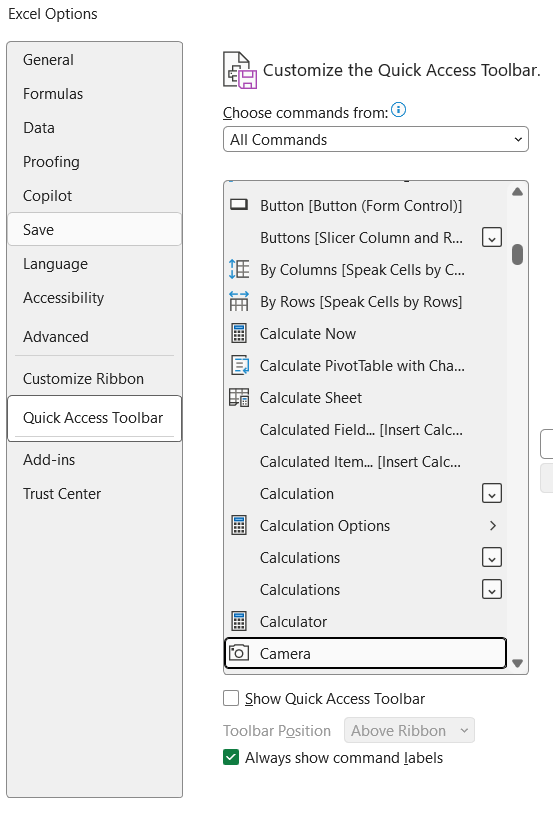
Under “Choose commands from,” select:
All Commands
Step 4
Scroll until you find:
Camera
Step 5
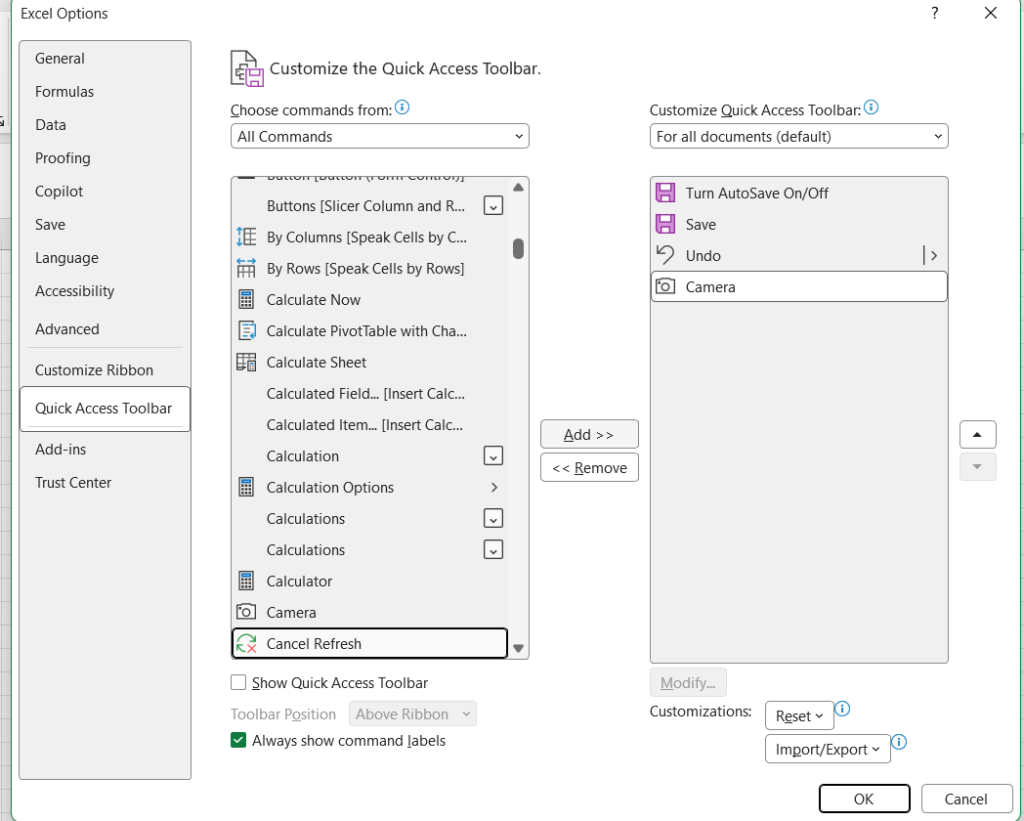
Click Add
Step 6
Press OK
You’ll now see a small camera icon at the top of Excel.
How to Create a Live Dashboard Using the Camera Tool
Here’s a simple workflow that works for almost every dashboard.
Select your data
Highlight the range you want to display.
This could be:
- Revenue KPI
- Sales summary
- Profit table
- Monthly report
- Pivot Table
Click the Camera Tool
After selecting the range, click the Camera icon.
Paste Anywhere
Move to your dashboard sheet.
Click once.
Excel inserts a live picture.
Resize and Position
Drag the corners just like an image.
Place it wherever you want on the dashboard.
You now have a clean dashboard element that updates automatically.
The Best Use Cases
The Camera Tool is surprisingly versatile.
1. Executive Dashboards
Executives don’t want to navigate multiple worksheets.
Instead, display the most important KPIs on one page.
Whenever data updates, the dashboard updates automatically.
2. Financial Reports
Finance teams often maintain detailed calculation sheets.
Rather than exposing every formula, show only the important summaries.
This creates cleaner reports while protecting the underlying calculations.
3. Sales Dashboards
Display live:
- Monthly sales
- Region performance
- Product ranking
- Revenue charts
Everything stays connected to the source data.
4. HR Dashboards
Track:
- Employee count
- Attendance
- Hiring status
- Department summaries
without duplicating information.
5. Management Presentations
Instead of exporting screenshots every week, simply refresh your workbook.
Your dashboard images update automatically, saving valuable reporting time.
Why the Camera Tool Is Better Than Screenshots
Many users still take screenshots when creating reports.
While that works initially, it quickly becomes frustrating.
Every time your data changes, you need to:
- Take another screenshot
- Crop it
- Replace the old image
- Realign everything
The Camera Tool removes all of those repetitive steps.
Instead of rebuilding your report every week, Excel updates the linked image automatically.
That’s a huge productivity boost.
Professional Tips for Better Dashboards
Here are a few tricks experienced Excel users follow.
Keep Source Sheets Clean
Organize your raw data separately from your dashboard.
This keeps your workbook easier to maintain.
Use Named Ranges
Named ranges make dashboard management much simpler, especially for larger workbooks.
Combine with Pivot Tables
When Pivot Tables refresh, Camera Tool images refresh too.
This creates highly dynamic reports.
Add Slicers
Slicers allow users to filter dashboards interactively.
Combined with the Camera Tool, they create dashboards that feel almost like business intelligence software.
Use Consistent Formatting
Because the Camera Tool copies formatting exactly, spend time designing attractive KPI cards and tables.
A clean source range creates an even better dashboard.
Are There Any Limitations?
Although it’s incredibly useful, the Camera Tool isn’t perfect.
Keep these points in mind:
- It’s hidden by default.
- Large workbooks with many linked images may become slightly slower.
- Source formatting directly affects the linked image.
- Deleting the original range breaks the connection.
For most dashboards, these limitations are minor compared to the time you’ll save.
Take Your Dashboards Even Further
The Camera Tool is only one piece of the puzzle.
Professional dashboards also include:
- Interactive filters
- Dynamic charts
- KPI cards
- Conditional formatting
- Timeline controls
- Automated reports
- Printable layouts
If you’re looking to create modern Excel dashboards faster, explore an Excel Dashboard Builder that helps you generate professional dashboard layouts, visual components, and reporting ideas in less time. It’s a practical way to speed up development whether you’re building dashboards for business, finance, HR, sales, or personal projects.
Final Thoughts
The Excel Camera Tool is one of those rare features that instantly improves the way you work.
It doesn’t require VBA.
It doesn’t require advanced formulas.
And it doesn’t require expensive business intelligence software.
Yet it can make your dashboards look cleaner, more professional, and much easier to maintain.
If you build reports regularly, it’s worth spending five minutes enabling this hidden feature. Once you start using it, you’ll likely never go back to static screenshots again.
Combine the Camera Tool with Pivot Tables, slicers, and a reliable Excel Dashboard Builder, and you’ll be able to create dashboards that are both visually impressive and incredibly easy to update.
Frequently Asked Questions
Is the Excel Camera Tool available in Microsoft 365?
Yes. It is available in Microsoft 365, although it isn’t shown on the Ribbon by default. You can add it through the Quick Access Toolbar settings.
Does the Camera Tool update automatically?
Yes. The linked image refreshes whenever the source cells or charts change.
Can I use it with Pivot Tables?
Absolutely. It’s an excellent way to display Pivot Table summaries on a dashboard while keeping the underlying data on separate worksheets.
Does the Camera Tool work with charts?
Yes. You can create live images of both charts and cell ranges, making it ideal for executive dashboards and reports.
Do I need VBA to use the Camera Tool?
No. Everything works without writing a single line of VBA code.
Suggested Internal Links
- Best Excel Dashboard Templates
- How to Create Interactive Excel Dashboards
- Excel KPI Dashboard Guide
- Excel Pivot Table Tutorial
- Excel Conditional Formatting Tips
- Excel Dashboard Builder


