
Free Excel Dashboard Generator: Upload Your Excel File and Create Interactive Dashboards in Seconds
Meta Description: Upload your Excel file and instantly create interactive dashboards with KPI cards, charts, filters, PDF export, Excel export and multi-currency support.
Excel remains one of the world’s most popular tools for managing business data. From finance and HR to sales and operations, millions of professionals rely on spreadsheets every day. However, turning raw spreadsheet data into meaningful reports often requires hours of manual work.
Our Free Excel Dashboard Generator solves this problem by allowing you to upload your Excel file and generate a professional interactive dashboard in seconds. Instead of creating Pivot Tables, formatting charts, building slicers and designing reports manually, you can focus on understanding your data.
Why Interactive Dashboards Matter
Modern businesses make decisions based on data. Interactive dashboards help transform thousands of spreadsheet rows into visual insights that are easy to understand. KPI cards, trend charts and filters allow managers to identify opportunities faster while saving valuable reporting time.
Key Features
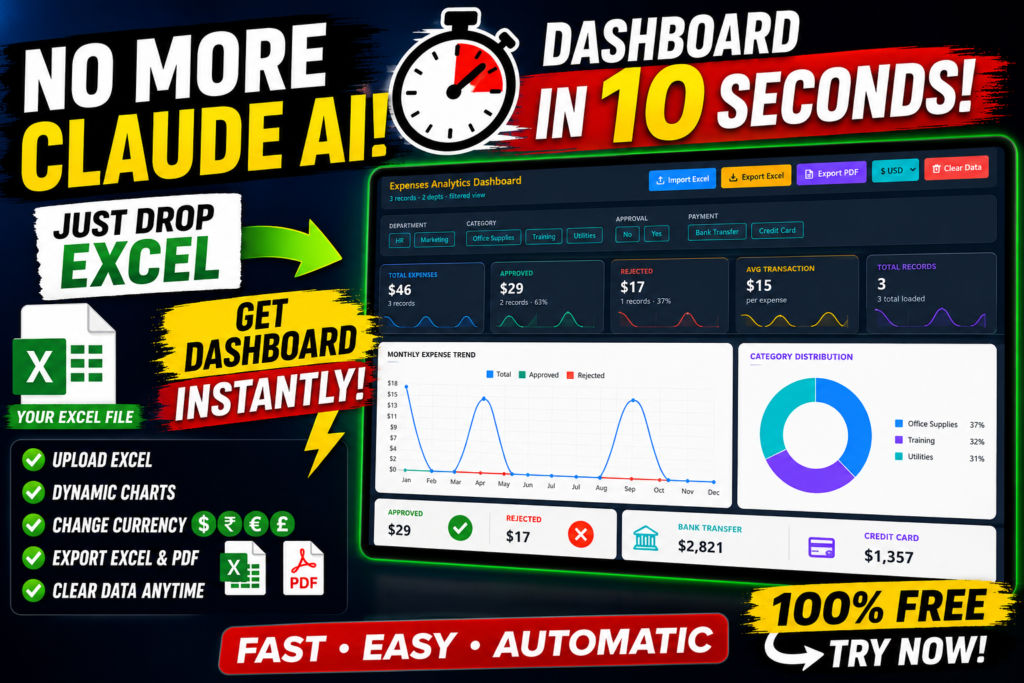
- Upload Excel files instantly
- Interactive charts and KPI cards
- Dynamic filters and slicers
- Export dashboard to PDF
- Export dashboard to Excel
- Multiple currency support
- Responsive design
- No coding required
Who Can Use This Dashboard?
- Business owners
- Finance teams
- HR professionals
- Sales managers
- Students
- Freelancers
How It Works
- Visit the Dashboard Library.
- Choose your dashboard.
- Upload your Excel file.
- Watch the dashboard generate automatically.
- Analyze, filter and export your reports.
Try the Interactive Expense Dashboard
Experience the dashboard yourself by visiting our interactive Expense Dashboard:
https://us.seoanalyser.in/dashboard/expense
Benefits
| Traditional Method | Dashboard Generator |
|---|---|
| Hours of manual work | Generate in seconds |
| Create charts manually | Automatic charts |
| Complex formulas | No coding required |
| Manual updates | Interactive filtering |
Frequently Asked Questions
Is the dashboard free?
Yes. The current version is available free to use.
Can I upload my own Excel file?
Yes. Simply upload your spreadsheet and explore the interactive dashboard.
Can I export reports?
Yes. Export to Excel and PDF.
Conclusion
If you regularly work with Excel reports, interactive dashboards can dramatically improve productivity. Instead of spending hours creating charts and reports manually, you can upload your spreadsheet and start analyzing your data almost immediately.
We continue to add new dashboards for finance, HR, KPI reporting, sales, inventory and project management. Bookmark our Dashboard Library and check back regularly for new releases.
Explore the complete Dashboard Library:
https://us.seoanalyser.in/dashboard/

