

How to Connect Slicer to Pivot Table:- Have you ever clicked on an Excel Slicer and expected your Pivot Chart to update, but nothing happened?
I recently faced this exact problem while working on an Excel dashboard. The dashboard had Pivot Tables, Pivot Charts, a Payment Method Slicer, and a Department Slicer.
Everything looked correct at first. The data was displaying properly, the charts were visible, and the Slicers were also working. But when I clicked on a Slicer, the chart was not updating.
After checking the dashboard, I found the actual problem: the Slicer was not connected to the correct Pivot Table.
The good news is that fixing this problem takes only a few clicks.
In this tutorial, I will show you exactly how to connect a Slicer to a Pivot Table so that your Pivot Chart updates automatically.
My Excel Dashboard Setup
For this example, I created an Excel dashboard using Department and Payment Method data.
The dashboard includes two interactive Slicers:
- Payment Method
- Department
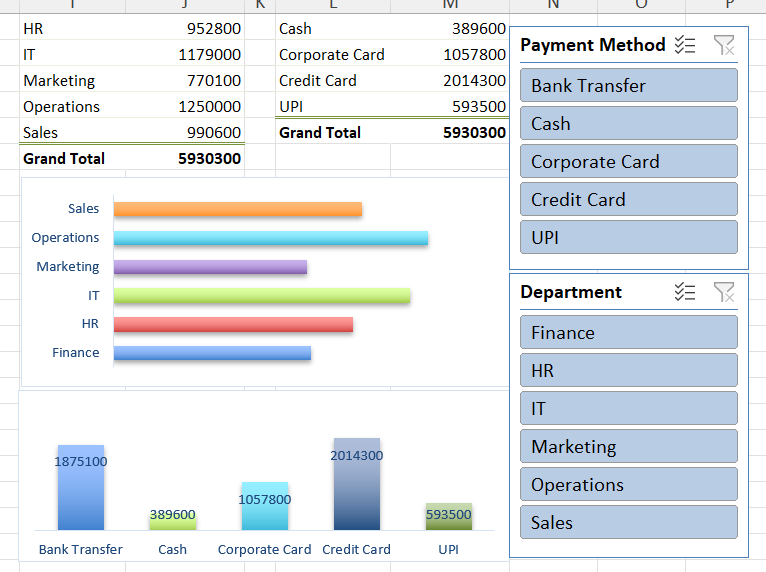
It also includes Pivot Tables and Pivot Charts to visualize the data.
Department Data
- Finance: 786,900
- HR: 952,800
- IT: 1,179,000
- Marketing: 771,000
- Operations: 1,250,000
- Sales: 990,600
Grand Total: 5,930,300
Payment Method Data
- Bank Transfer: 1,875,100
- Cash: 389,600
- Corporate Card: 1,057,800
- Credit Card: 2,014,300
- UPI: 593,500
Grand Total: 5,930,300
The Problem: Excel Slicer Was Not Updating the Pivot Chart
After creating the dashboard, I clicked on the Payment Method Slicer.
I selected Bank Transfer.
However, the chart did not update.
I then tried selecting Cash, Corporate Card, Credit Card, and UPI. The chart still did not change.
Next, I tested the Department Slicer. Again, the chart was not responding as expected.
This is when I checked the Report Connections setting in Excel.
How to Connect a Slicer to a Pivot Table in Excel
Here is exactly how I fixed the problem.
Step 1: Select the Slicer
First, click on the Slicer that is not updating your Pivot Chart.
In my example, I selected the Payment Method Slicer.
The Payment Method Slicer contains Bank Transfer, Cash, Corporate Card, Credit Card, and UPI.
Once you select the Slicer, Excel will display the Slicer tab in the Ribbon.
Step 2: Open the Slicer Tab
After selecting the Slicer, go to the Excel Ribbon.
Click on the Slicer tab.
You will see several options for managing the selected Slicer.
Look for the option called Report Connections.
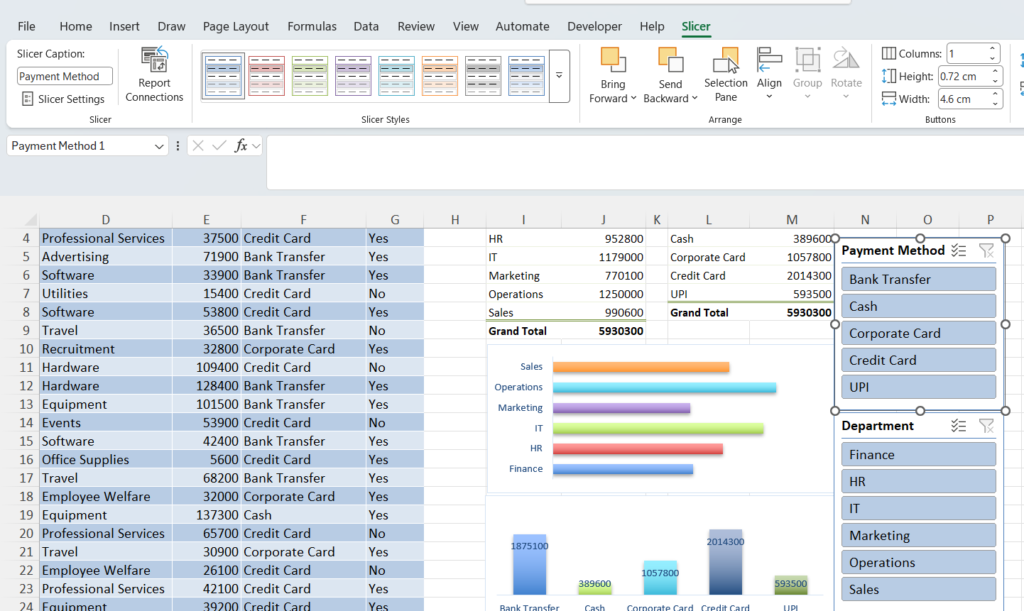
Step 3: Click on Report Connections
Click on Report Connections.
A small pop-up window will appear.
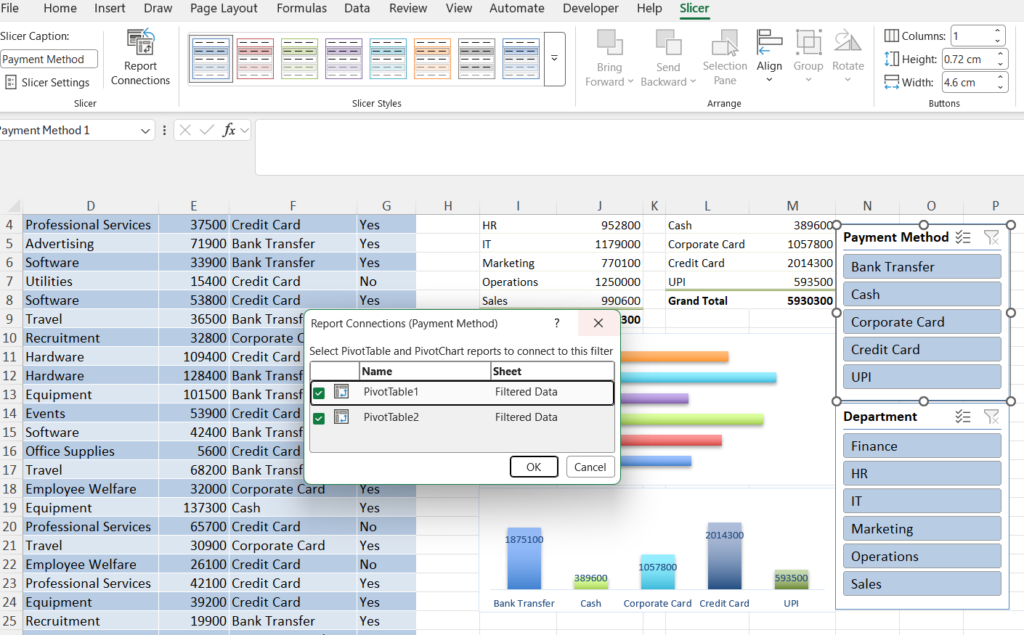
This window displays the Pivot Tables that are available to connect with the selected Slicer.
This is the most important step because you need to select the Pivot Table that controls the chart you want to update.
Step 4: Select the Correct Pivot Table
Look at the available Pivot Tables in the Report Connections window.
Select the Pivot Table connected to your chart.
For example, if you want the Payment Method Slicer to update the Payment Method Pivot Chart, select the correct Payment Method Pivot Table.
Once you have selected it, click OK.
Your Slicer is now connected to the Pivot Table.
Step 5: Test the Slicer
Now click on your Slicer again.
Select Bank Transfer and check whether the Pivot Table updates.
Then try Cash, Corporate Card, Credit Card, and UPI.
Your connected Pivot Table should now update.
Because your Pivot Chart is connected to that Pivot Table, the chart should also update automatically.
How to Connect the Department Slicer
I also had a Department Slicer in my Excel dashboard.
The Department Slicer contains Finance, HR, IT, Marketing, Operations, and Sales.
I followed the same process.
Select the Department Slicer
First, click on the Department Slicer.
Then go to the Slicer tab in the Excel Ribbon.
Open Report Connections
Click on Report Connections.
Excel will display the available Pivot Tables.
Connect the Correct Pivot Table
Select the Pivot Table that is used by your Department Chart.
Click OK.
Now test the Department Slicer by selecting different departments.
The connected Pivot Table and Pivot Chart should update automatically.
Why Was My Excel Slicer Not Updating the Chart?
In my case, the problem was simple.
The Slicer was not connected to the correct Pivot Table.
A Slicer filters the Pivot Tables connected through Report Connections.
If your chart is based on a Pivot Table that is not connected to the Slicer, clicking on the Slicer will not update that chart.
Once I connected the correct Pivot Table, the chart started updating properly.
How to Connect One Slicer to Multiple Pivot Tables
One of the most useful features of Excel Slicers is the ability to connect one Slicer to multiple Pivot Tables.
This is especially useful when creating an interactive Excel dashboard.
Select the Slicer
Click on the Slicer you want to use.
Open Report Connections
Go to the Slicer tab and click Report Connections.
Select Multiple Pivot Tables
Select all the Pivot Tables you want the Slicer to control.
Click OK.
Now one Slicer can update multiple reports in your dashboard.
Common Reasons Why an Excel Slicer Does Not Update a Pivot Chart
The Slicer Is Not Connected to the Pivot Table
This is the most common problem.
Select the Slicer, go to the Slicer tab, click Report Connections, select the correct Pivot Table, and click OK.
The Chart Uses a Different Pivot Table
Sometimes the Slicer is connected to one Pivot Table, but your chart is based on another Pivot Table.
In this situation, the chart will not update as expected.
Check which Pivot Table is connected to your chart and then check the Report Connections settings.
The Pivot Tables Use Different Data Sources
Sometimes you cannot connect one Slicer to multiple Pivot Tables.
This may happen when the Pivot Tables use different data sources or are not compatible with the same Slicer connection.
Why Use Slicers in Excel Dashboards?
Slicers make Excel dashboards easier to use and more interactive.
Instead of opening a filter dropdown, users can simply click on a button.
Slicers are especially useful for:
- Sales Dashboards
- HR Dashboards
- Financial Dashboards
- Expense Dashboards
- KPI Dashboards
- Employee Performance Dashboards
Tips for Using Excel Slicers
Keep Slicers Organized
Try to place your Slicers in one area of the dashboard.
In my dashboard, I placed the Payment Method and Department Slicers together on the right side.
This keeps the dashboard clean and easy to understand.
Use Clear Slicer Names
Use simple names such as Department, Payment Method, Year, Region, and Category.
Clear names help users understand what each Slicer controls.
Test Every Slicer
After creating your dashboard, test every Slicer.
Check whether your Pivot Tables, Pivot Charts, KPIs, and dashboard reports are updating correctly.
Frequently Asked Questions
Can One Slicer Control Multiple Pivot Tables?
Yes. Select the Slicer, open Report Connections, and select all the Pivot Tables you want to connect.
Can Multiple Slicers Control One Pivot Table?
Yes. You can use Department, Payment Method, Year, and Category Slicers to filter the same Pivot Table when configured correctly.
Why Is My Excel Slicer Not Updating My Pivot Chart?
The most common reason is that the Slicer is not connected to the Pivot Table used by the chart.
Open Report Connections and check whether the correct Pivot Table is selected.
What Is Report Connections in Excel?
Report Connections is an Excel feature that allows you to connect a Slicer to one or more Pivot Tables.
It is especially useful when creating interactive Excel dashboards with multiple reports and charts.
Final Thoughts
If your Excel Slicer is not updating your Pivot Chart, check the Report Connections settings first.
In my case, this was the entire problem.
Here is the quick process:
- Select the Slicer.
- Go to the Slicer tab.
- Click Report Connections.
- Select the correct Pivot Table.
- Click OK.
- Test the Slicer.
Once the correct connection is created, your Pivot Table and Pivot Chart should update automatically.
I used this method to fix my own Excel dashboard with Department and Payment Method data totaling 5,930,300.
It is a simple Excel feature, but it can make a big difference when building professional and interactive dashboards.
Learn More Excel Tips and Tricks
At Excel Tricks, I share practical Excel tutorials using real examples and dashboards.
You can learn about:
- Excel Formulas
- Pivot Tables
- Pivot Charts
- Excel Dashboards
- Power Query
- VBA Automation
- Microsoft Excel 365


Pingback: 25+ Excel Keyboard Shortcuts That Can Save You Hours — Free Visual PDF Guide - Excel AI Tools and SEO Guides