
Why Some Excel Users Finish 8 Hours of Work in 2 Hours
Excel Mastery: Imagine two employees working on the same monthly sales report.
The first employee manually cleans data, copies formulas, creates reports, and spends hours fixing mistakes.
The second employee clicks a refresh button and the entire dashboard updates automatically.
Both use Microsoft Excel.
The difference isn’t intelligence.
The difference is mastery.
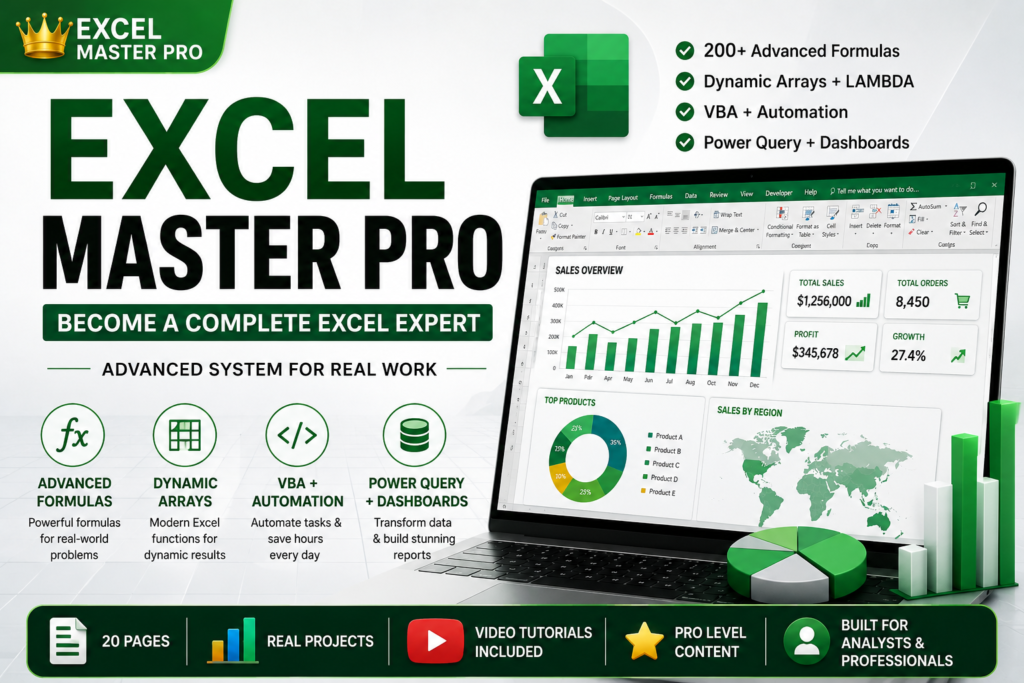
In today’s data-driven workplace, Excel remains one of the most valuable business skills. Whether you’re a business analyst, accountant, project manager, financial professional, HR specialist, or entrepreneur, advanced Excel knowledge can dramatically increase productivity, improve decision-making, and open doors to higher-paying opportunities.
This guide covers the exact Excel skills professionals use to automate repetitive work, analyze large datasets, build interactive dashboards, and become indispensable in their organizations.
1. Master Excel Shortcuts to Work Faster Than Most Users
One of the easiest ways to improve productivity is learning keyboard shortcuts.
Many professionals lose hours every week simply because they rely on the mouse for tasks that can be completed instantly with keyboard commands.
Essential Navigation Shortcuts
| Shortcut | Purpose |
|---|---|
| Ctrl + Arrow Keys | Jump across large datasets |
| Ctrl + Home | Go to beginning of worksheet |
| Ctrl + End | Go to last used cell |
| F5 | Jump directly to a cell or range |
| Ctrl + Shift + Arrow | Select entire data range |
Why It Matters
If you work with thousands of rows of data, these shortcuts can reduce navigation time by more than 50%.
A financial analyst reviewing 50,000 records can save several minutes every day using shortcut-based navigation.
2. Advanced Excel Formulas Every Professional Should Know
Most Excel users only use SUM and AVERAGE.
Professionals use formulas that retrieve, analyze, and transform data automatically.
VLOOKUP vs INDEX MATCH
For years, VLOOKUP was the most popular lookup formula.
However, INDEX MATCH offers greater flexibility.
Example Scenario
You have:
- Employee ID
- Employee Name
- Department
- Salary
Instead of manually searching for salary information, INDEX MATCH can instantly retrieve the correct value.
Benefits include:
- Faster calculations
- More flexibility
- Ability to search left and right
- Better performance in large workbooks
SUMIFS and COUNTIFS
These formulas allow multiple criteria analysis.
Example:
- Total sales for New York
- Sales above $10,000
- Orders completed in May
Instead of filtering manually, Excel calculates everything automatically.
Business Impact
Managers can generate performance reports in seconds rather than hours.
3. Dynamic Arrays Are Changing Excel Forever
Traditional Excel formulas often required helper columns and complicated workarounds.
Modern Excel introduces Dynamic Arrays that automatically spill results into multiple cells.
UNIQUE Function
Removes duplicate values instantly.
Example Uses:
- Customer lists
- Product categories
- Employee departments
SORT Function
Automatically sorts data whenever source data changes.
Benefits:
- Dynamic reporting
- Cleaner dashboards
- Reduced manual maintenance
FILTER Function
One of the most powerful additions to Excel.
Imagine a sales database with 100,000 rows.
FILTER allows users to instantly display:
- Only sales employees
- Only completed orders
- Only high-value transactions
without creating separate reports.
4. LAMBDA Functions: Create Your Own Excel Functions Without VBA
One of the most revolutionary Excel features is LAMBDA.
Most users don’t realize they can create custom formulas without writing VBA code.
Example
Instead of repeatedly writing complex formulas, you can create a reusable custom function.
Benefits include:
- Less repetitive work
- Easier workbook maintenance
- Improved accuracy
- Professional-grade solutions
Organizations that use LAMBDA extensively often reduce formula complexity dramatically.
5. VBA Automation: The Skill That Separates Experts From Average Users
If Excel formulas save minutes, VBA saves hours.
Visual Basic for Applications (VBA) enables users to automate repetitive tasks completely.
Common VBA Automations
Automated Reporting
Generate monthly reports with one click.
Email Automation
Send reports directly from Excel.
Data Cleaning
Automatically remove duplicates, format records, and standardize information.
Dashboard Refresh
Update charts and reports instantly.
Real-World Example
A company that spends three hours creating a weekly report can reduce that process to less than five minutes using VBA automation.
That equals more than 120 hours saved annually.
6. Power Query: The Secret Weapon of Data Analysts
Power Query is often considered the most valuable Excel feature introduced in the last decade.
It allows users to:
- Import data
- Clean data
- Transform data
- Merge data
- Refresh reports automatically
Why Businesses Love Power Query
Instead of manually cleaning files every month, users create a transformation workflow once.
Future updates require only a single refresh.
Common Use Cases
- Sales reporting
- Inventory management
- Financial consolidation
- HR analytics
- Customer analysis
7. Build Interactive Dashboards Like a Business Intelligence Professional
Data becomes valuable only when decision-makers can understand it.
Dashboards transform raw numbers into visual insights.
Key Dashboard Components
KPI Cards
Display:
- Revenue
- Profit
- Growth
- Conversion Rate
Charts
Visualize:
- Trends
- Comparisons
- Performance
Slicers
Allow users to filter reports instantly.
Timelines
Analyze data across different time periods.
Dashboard Best Practices
- Keep layouts clean
- Avoid excessive colors
- Focus on key metrics
- Make dashboards interactive
- Highlight actionable insights
A well-designed dashboard can replace dozens of static reports.
8. Data Validation and Conditional Formatting
Poor data quality leads to poor decisions.
Data Validation helps prevent mistakes before they happen.
Examples
Restrict Entries
Allow only:
- Dates
- Numbers
- Approved categories
Create Drop-Down Lists
Ensure consistent data entry across teams.
Conditional Formatting
Automatically highlight:
- Top performers
- Low inventory
- Overdue tasks
- Duplicate records
Decision-makers can immediately identify important information.
9. Advanced Data Analysis Tools Hidden Inside Excel
Many users never explore Excel’s advanced analytical capabilities.
Yet these tools can replace expensive software for many tasks.
Goal Seek
Determine the required input to achieve a desired outcome.
Example
What sales amount is needed to achieve a profit target?
Scenario Manager
Compare multiple business scenarios.
Example
- Best case
- Worst case
- Expected case
Data Tables
Perform sensitivity analysis and evaluate multiple variables simultaneously.
10. Power Pivot and DAX for Large-Scale Data Analysis
When standard Excel reaches its limits, Power Pivot takes over.
Power Pivot enables analysis of millions of rows while maintaining excellent performance.
Benefits
- Relationship modeling
- Enterprise reporting
- Large datasets
- Advanced calculations
DAX Formulas
DAX is the calculation language behind Power Pivot.
It enables:
- Year-over-Year comparisons
- Running totals
- Time intelligence calculations
- Advanced KPIs
This is the same technology powering many business intelligence solutions.
Excel Best Practices Used by Professionals
To build reliable workbooks:
Use Excel Tables
Tables automatically expand and improve formula management.
Avoid Merged Cells
Merged cells often break sorting and filtering.
Use Named Ranges
Makes formulas easier to understand and audit.
Handle Errors Gracefully
Use IFERROR to create cleaner reports.
Optimize Performance
Avoid unnecessary volatile formulas and excessive formatting.
The Future of Excel
Excel continues evolving rapidly.
Modern features such as:
- Dynamic Arrays
- Power Query
- Power Pivot
- LAMBDA
- Office Scripts
- AI-assisted analysis
are transforming how professionals work with data.
Those who master these tools gain a significant competitive advantage in today’s workplace.
PDF Download
Final Thoughts
Excel is no longer just a spreadsheet application.
It has become a complete business intelligence, automation, reporting, and analytics platform.
Professionals who learn advanced formulas, VBA, Power Query, dashboards, and Power Pivot can dramatically improve productivity, reduce manual work, and create insights that drive better business decisions.
Whether you’re an analyst, manager, entrepreneur, accountant, or student, investing time in advanced Excel skills remains one of the highest-return career investments you can make.
Frequently Asked Questions
What is the most important Excel skill to learn first?
Start with advanced formulas such as INDEX MATCH, SUMIFS, COUNTIFS, and IF functions before moving to Power Query and VBA.
Is VBA still worth learning in 2026?
Yes. VBA remains widely used in businesses worldwide for automating repetitive Excel tasks.
What is better: Power Query or VBA?
They serve different purposes. Power Query is ideal for data transformation, while VBA excels at automation and workflow management.
Can Excel handle large datasets?
Yes. With Power Pivot and the Data Model, Excel can efficiently analyze millions of rows of data.
How long does it take to become advanced in Excel?
With consistent practice, most users can reach an advanced level within 3–6 months.

