
HR Teams Waste Hours Every Month Creating Attendance Reports — Here’s a Better Way
Imagine it’s the last day of the month. Your HR team receives hundreds or even thousands of employee attendance records. Now comes the tedious task of calculating working hours, identifying late arrivals, tracking overtime, and preparing management reports.
For many businesses, this process still involves manual formulas, endless copy-pasting, and repetitive calculations.
But what if you could automate the entire process?
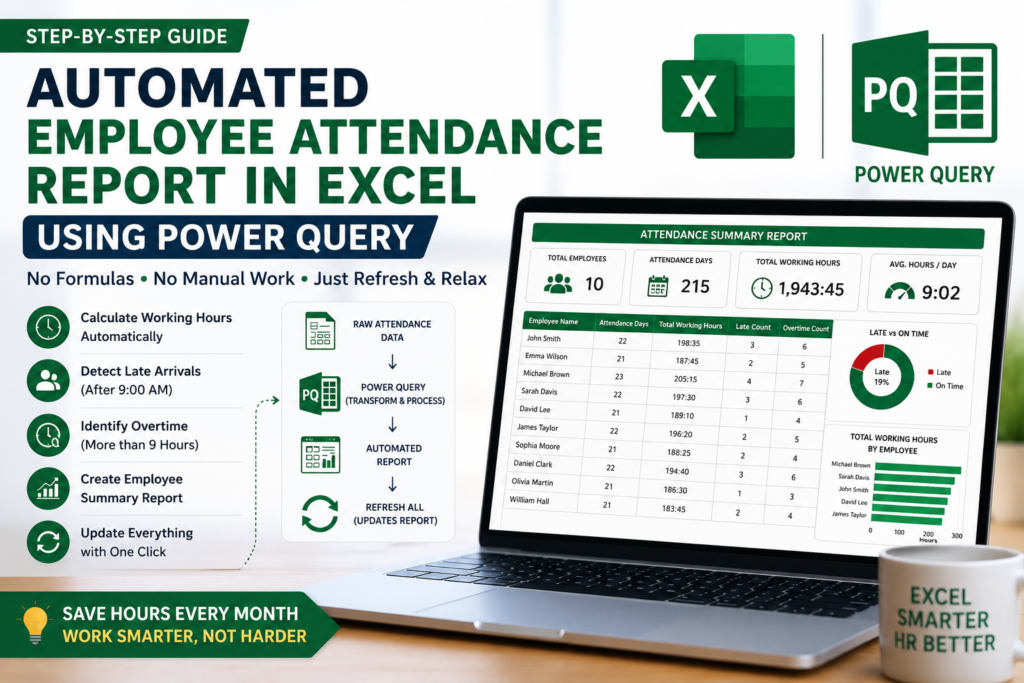
Using Excel Power Query, you can transform raw attendance data into a professional attendance report that updates with a single click. No complex formulas. No VBA. No manual work every month.
In this guide, you’ll learn how to create an automated employee attendance report in Excel using Power Query and why it can save hours of work every month.
A Real-World HR Scenario
Meet Sarah, an HR executive responsible for managing attendance records for 200 employees.
Every month she had to:
- Import attendance data
- Calculate working hours
- Identify late arrivals
- Track overtime
- Prepare management reports
The process took nearly three hours every month.
After implementing a Power Query-based attendance reporting system, the same task now takes less than two minutes.
All she does is:
- Paste the latest attendance data.
- Click Refresh.
- Download the updated report.
That’s the power of automation.
What You Can Automate with Power Query
An automated attendance report can instantly calculate:
Working Hours
Power Query calculates the difference between employee In Time and Out Time.
Example:
| In Time | Out Time | Working Hours |
|---|---|---|
| 08:50 | 18:10 | 09:20 |
| 08:40 | 17:15 | 08:35 |
| 09:15 | 18:30 | 09:15 |
Late Arrivals
Employees arriving after the official office start time can be automatically flagged.
Example:
| In Time | Status |
|---|---|
| 08:50 | On Time |
| 09:15 | Late |
| 09:25 | Late |
This helps HR teams monitor punctuality without manually checking attendance logs.
Overtime Tracking
Power Query can identify employees who work beyond standard working hours.
Example:
| Working Hours | Overtime |
|---|---|
| 09:20 | Yes |
| 08:35 | No |
| 09:45 | Yes |
Overtime tracking becomes fully automated and consistent.
Required Attendance Data Structure
Your attendance sheet should contain the following columns:
| Employee Name | Date | In Time | Out Time |
|---|---|---|---|
| John Smith | 01-Jan-2026 | 08:50 | 18:10 |
| Emma Wilson | 02-Jan-2026 | 08:40 | 17:15 |
| Michael Brown | 03-Jan-2026 | 09:15 | 18:30 |
Keeping a consistent structure ensures Power Query can refresh reports without errors.
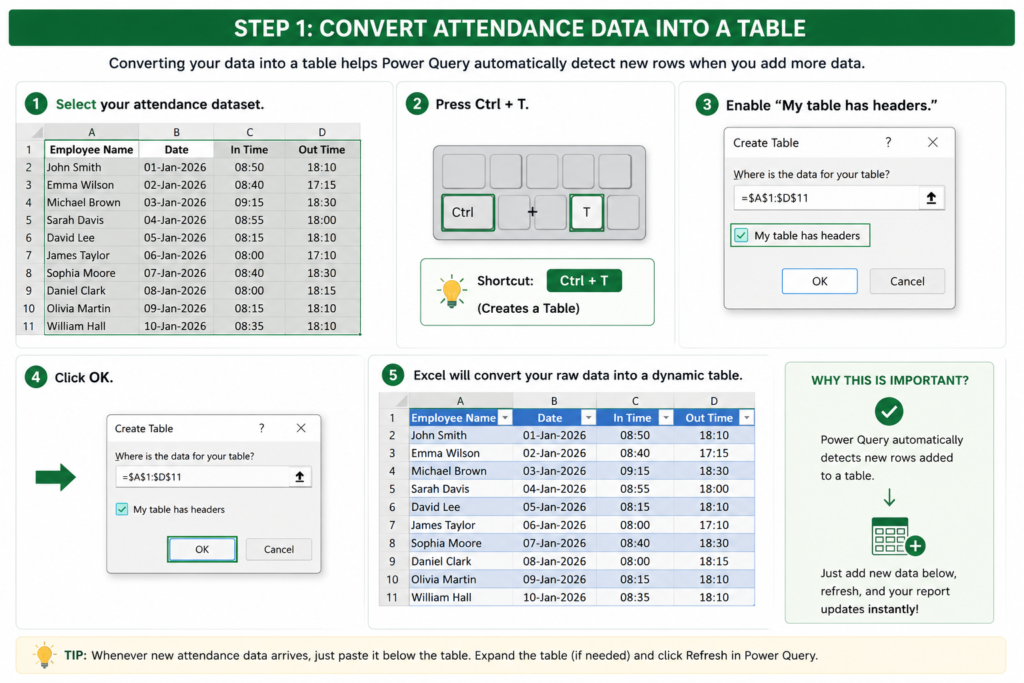
Step 1: Convert Attendance Data into a Table
Before importing data into Power Query:
- Select your attendance dataset.
- Press Ctrl + T.
- Enable “My table has headers.”
- Click OK.
Excel will convert your raw data into a dynamic table.
This is important because Power Query automatically detects new rows added to a table.
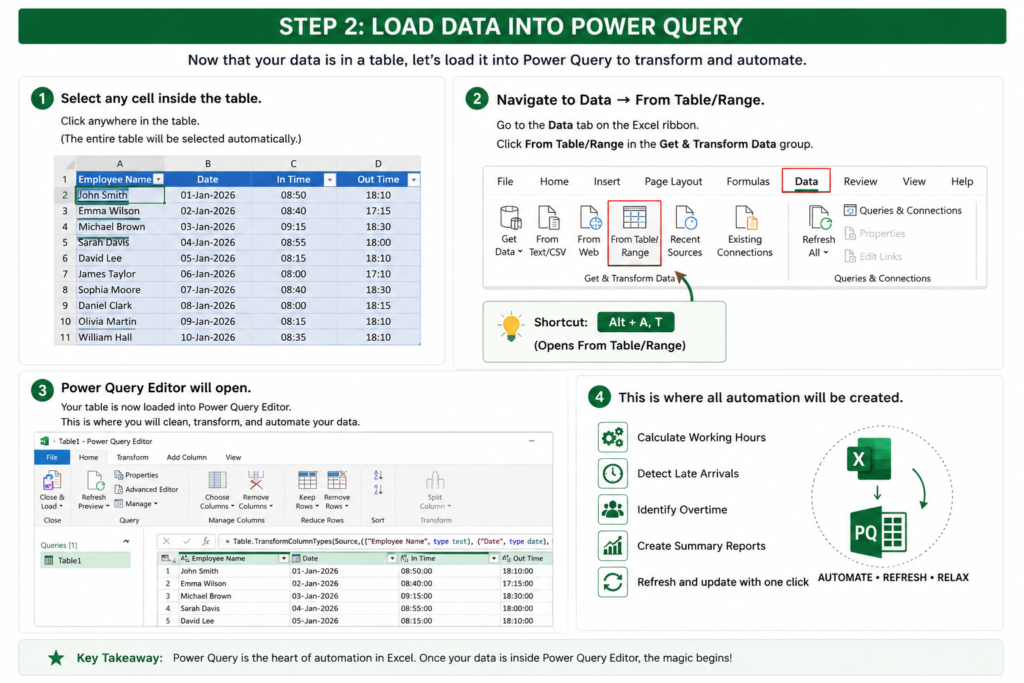
Step 2: Load Data into Power Query
Next:
- Select any cell inside the table.
- Navigate to Data → From Table/Range.
- Power Query Editor will open.
This is where all automation will be created.
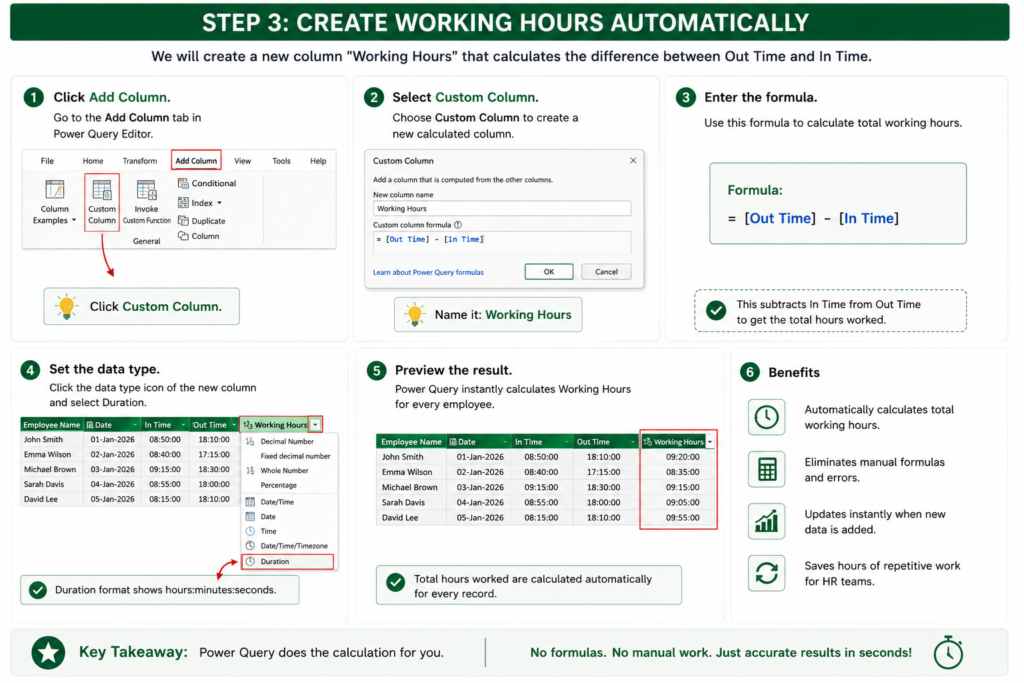
Step 3: Create Working Hours Automatically
Inside Power Query:
- Click Add Column.
- Select Custom Column.
Create a new column called:
Working Hours
Formula:
Out Time minus In Time.
Power Query instantly calculates total hours worked for every employee.
This removes the need for manual Excel formulas.
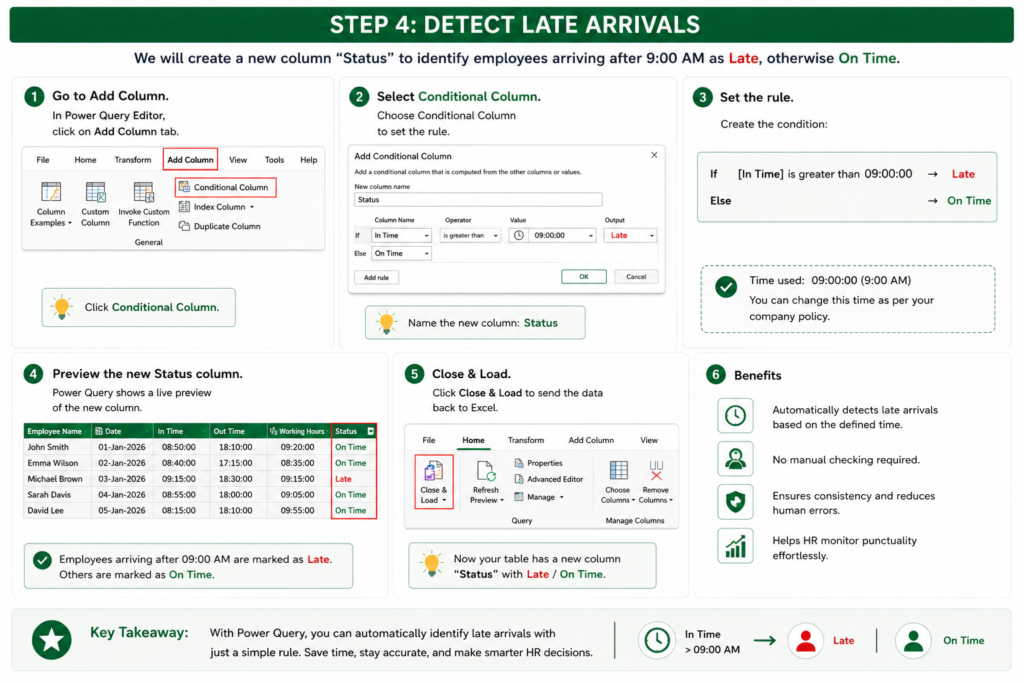
Step 4: Detect Late Arrivals
To identify employees arriving after 9:00 AM:
- Go to Add Column.
- Select Conditional Column.
Create a column named:
Status
Rule:
- If In Time is greater than 09:00 AM → Late
- Otherwise → On Time
Every employee is now categorized automatically.
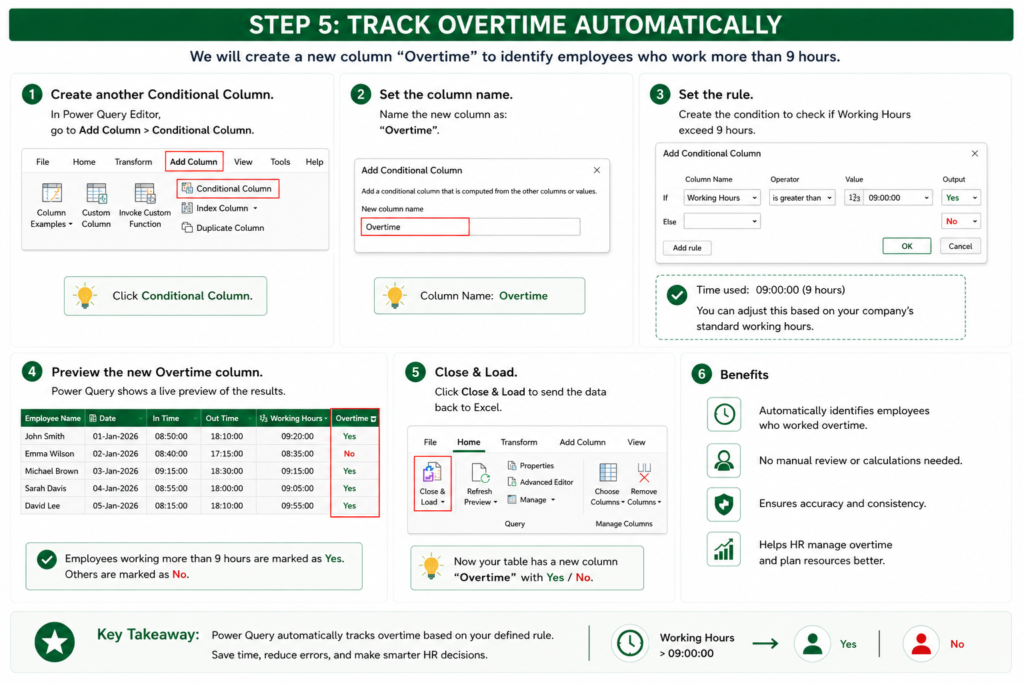
Step 5: Track Overtime Automatically
Create another Conditional Column.
Column Name:
Overtime
Rule:
- If Working Hours exceed 9 hours → Yes
- Otherwise → No
This allows HR teams to identify overtime without any manual review.
Step 6: Create a Summary Report
Now comes the most powerful feature.
Duplicate your query and use Group By.
Group by:
Employee Name
Create these metrics:
Attendance Days
Count the number of attendance records for each employee.
Total Working Hours
Calculate the total working hours for the month.
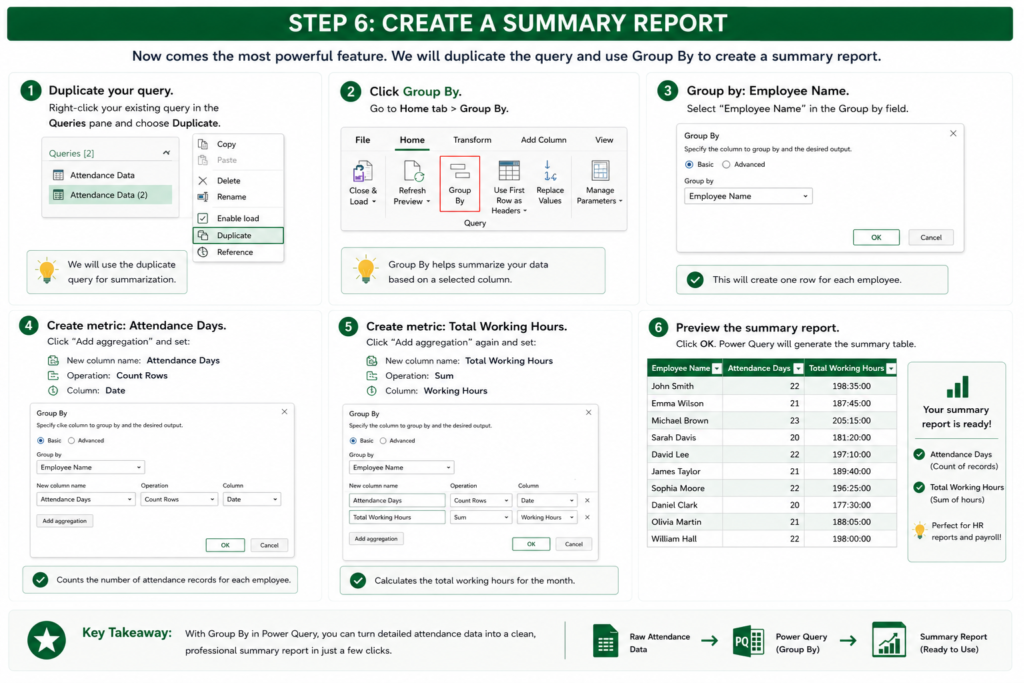
Your report instantly becomes:
| Employee | Attendance Days | Total Working Hours |
|---|---|---|
| John Smith | 22 | 198:35 |
| Emma Wilson | 21 | 187:45 |
| Michael Brown | 23 | 205:15 |
This is the type of report managers and HR teams actually need.
The One-Click Refresh Magic
This is where Power Query truly shines.
Imagine next month arrives.
Instead of rebuilding reports:
- Paste new attendance data.
- Click Data → Refresh All.
Power Query automatically:
- Updates working hours
- Recalculates overtime
- Identifies late arrivals
- Refreshes attendance summaries
The entire report updates within seconds.
No formulas need to be copied.
No manual calculations are required.
Benefits of Automating Attendance Reports
Saves Hours Every Month
Manual attendance reporting can take hours.
Automation reduces the process to minutes.
Reduces Human Errors
Manual calculations often introduce mistakes.
Power Query performs calculations consistently every time.
Scales Easily
Whether you have:
- 20 employees
- 200 employees
- 2,000 employees
The same report continues to work.
Easy to Maintain
Once built, the system only requires fresh attendance data.
Everything else updates automatically.
Better Decision Making
Managers gain access to:
- Employee attendance trends
- Overtime analysis
- Punctuality reports
- Workforce productivity insights
Common Mistakes to Avoid
Incorrect Time Format
Ensure In Time and Out Time columns use the Time data type.
Incorrect formatting can produce inaccurate results.
Loading Raw Data Instead of Tables
Always convert attendance data into an Excel Table before importing.
Tables automatically expand when new records are added.
Forgetting to Refresh
Power Query does not update automatically when new rows are pasted.
Always use:
Data → Refresh All
after updating attendance records.
Why Power Query Is Better Than Traditional Formulas
Many users rely on formulas like:
While these formulas work, they become difficult to manage as datasets grow.
Power Query offers:
- Better performance
- Easier maintenance
- Faster processing
- Cleaner workflows
- One-click automation
For attendance reporting, Power Query is often the most efficient solution.
Final Thoughts
Employee attendance reporting is one of the most repetitive tasks in HR operations. Manually calculating working hours, overtime, and attendance summaries every month wastes valuable time and increases the risk of errors.
With Excel Power Query, you can build a fully automated attendance reporting system that transforms raw attendance data into professional reports with just a single refresh.
Whether you’re an HR executive, office administrator, payroll specialist, manager, or Excel enthusiast, learning Power Query can dramatically improve productivity and eliminate repetitive work.
The best part? Once your report is built, the only thing you’ll need to do next month is paste the latest attendance data and click Refresh All.


Pingback: How to Create a Professional Table of Contents (TOC) in Excel Using VBA-2026 - Excel AI Tools and SEO Guides