
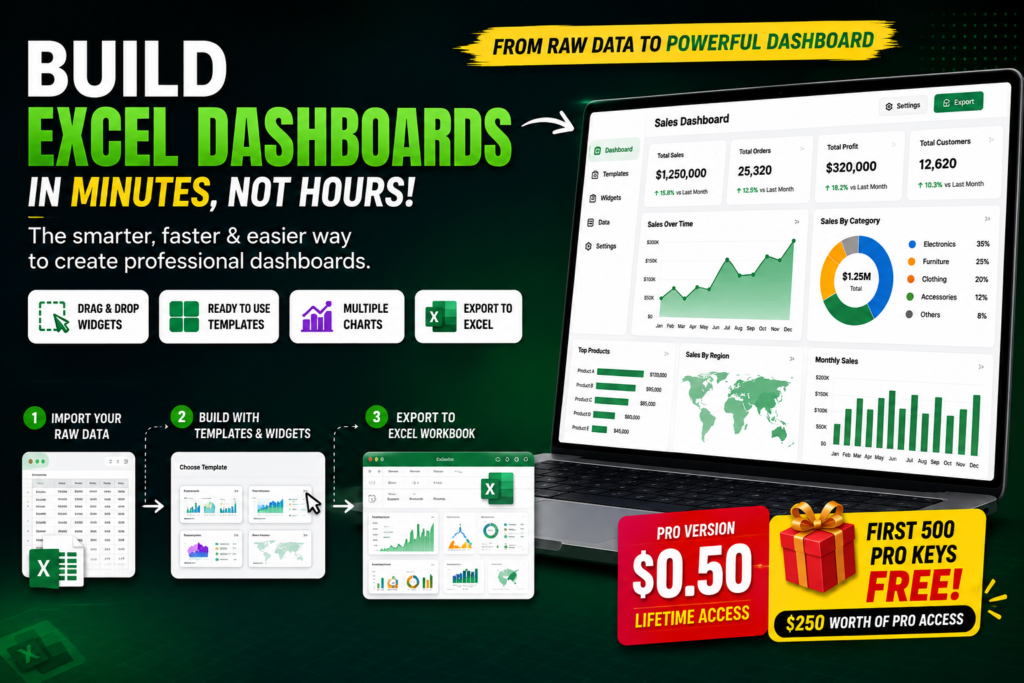

Excel Dashboards If you have ever built an Excel dashboard from scratch, you probably know how quickly a “simple report” can turn into a few hours of work.
First, you have to clean the data. Then you start deciding which KPIs to show, which charts to use, where everything should go, how the dashboard should look, and how to keep the whole thing readable.
And if someone asks for one more chart at the end?
Back to editing.
That is exactly why I was interested in a new approach to building Excel dashboards: instead of creating everything manually, why not start with a dashboard builder that already has templates, widgets, and an Excel export workflow?
I recently tested this approach, and the result was surprisingly simple.
The idea is simple: stop starting from a blank Excel sheet
The biggest problem with traditional dashboard creation isn’t Excel itself.
Excel is extremely powerful.
The problem is that many people start with a blank workbook and then build everything piece by piece.
You create the layout.
Then the KPI cards.
Then the charts.
Then the formatting.
Then the filters.
Then you adjust everything again because the dashboard doesn’t look quite right.
A dashboard builder takes a different approach.
Instead of asking, “How do I build this dashboard?”, you start by asking, “Which dashboard do I want to create?”
https://us.seoanalyser.in/dashboard/dashboardbuilder

That small change can make the entire process feel different.
The tool I tested provides built-in dashboard templates and widgets that can be arranged using a drag-and-drop workflow. You can import your existing Excel data, choose a template, customize the dashboard, and then export the result back into an Excel workbook.
For anyone who regularly creates sales reports, management dashboards, KPI reports, or similar Excel-based reporting, that workflow is worth looking at.
I started with a normal Excel dataset
For the test, I used a raw Excel dataset rather than an already-prepared dashboard.
This is important because a dashboard builder is only useful if it can handle the starting point most Excel users actually have: a spreadsheet full of rows and columns.
The process starts by uploading the Excel file.
You can simply drag and drop the file into the builder and import the sheet.
After importing, the data can be reviewed before moving into the dashboard-building stage.
This is a useful step because it gives you an opportunity to check whether the columns have been recognized correctly before you start designing the dashboard.
Once the data looks good, you can move forward.
Then comes the interesting part: templates
This is probably the part that will save the most time for people who don’t want to design every dashboard from zero.

Instead of staring at a blank canvas, you can browse the available dashboard templates.
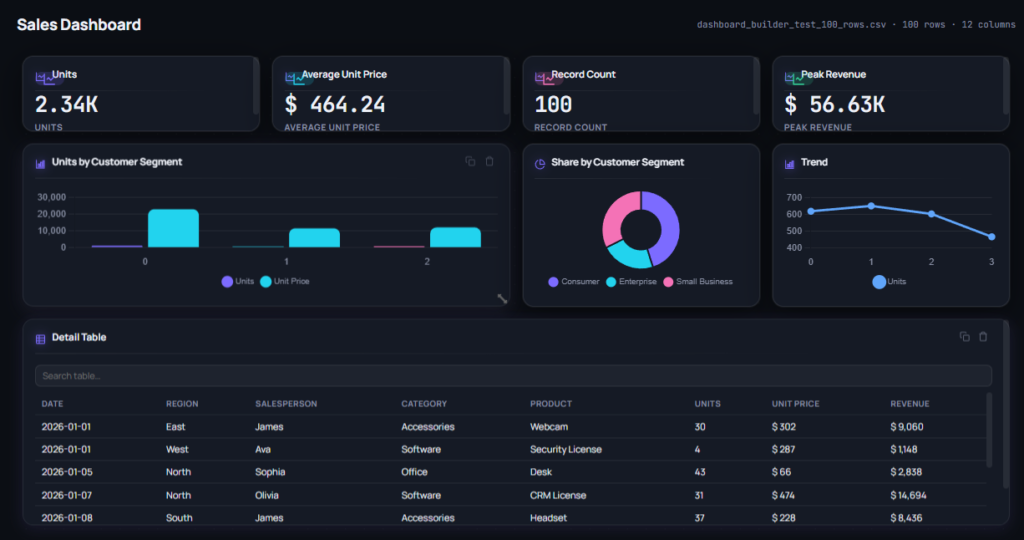
For this example, I selected a Sales Dashboard template.
And almost immediately, the basic structure was there.
The dashboard included KPI sections and charts, giving me a starting point instead of forcing me to create every element manually.
This doesn’t mean the dashboard is automatically perfect.
That’s actually a good thing.
The template gives you the foundation. You can then customize it according to the data and the story you want the dashboard to tell.
You can add and remove widgets
This is where the drag-and-drop approach becomes useful.
Don’t need a particular table?
Remove it.
Want another chart?
Add one.
Want to change the type of visualization?
Choose another widget.
For example, I replaced a table with an area chart.
You can also select the data used for the X-axis and Y-axis.
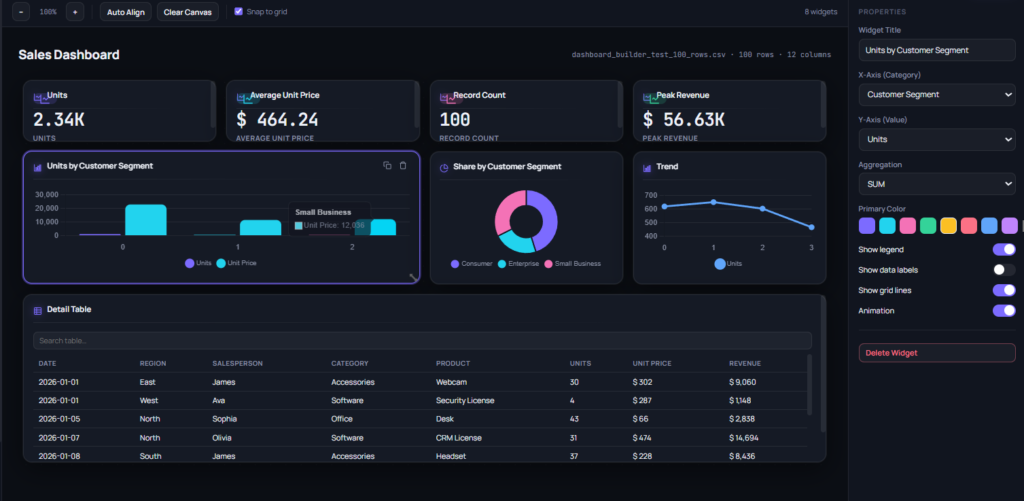
During the editing process, you may see temporary values such as 0, 1, or 2 while selecting fields. That can look confusing at first, but these are not necessarily the final labels you will see in the exported Excel workbook.
The important part is that the dashboard is being built around your actual data rather than requiring you to recreate everything manually.
What about customization?
A dashboard is not just about putting charts on a screen.
The small customization features matter too.
The builder includes options for choosing currency symbols and changing the dashboard theme. That can be useful when you’re creating dashboards for different businesses, countries, or reporting requirements.
There are also Undo and Redo options.
That might sound like a small feature, but anyone who has spent time experimenting with a dashboard knows how useful it is.
You can try something.
Don’t like it?
Undo it.
Want to bring it back?
Redo it.
It makes the editing process much less stressful.
The final test: can it actually become an Excel dashboard?
This was the part I cared about most.
It is easy for a dashboard tool to create something that looks good inside a web application.
But if your workflow ultimately depends on Excel, the real question is:
Can I get the finished dashboard back into Excel?
The answer in my test was yes.
After finishing the dashboard, I selected Export, chose Excel Workbook, and opened the downloaded file.
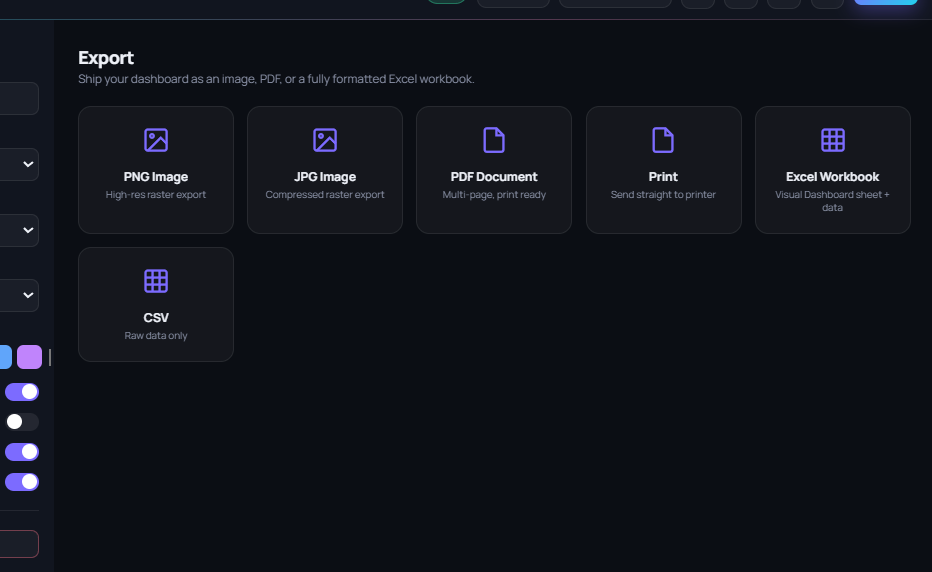
The exported workbook contained the dashboard with the KPIs and charts.
That is where the whole workflow starts to make sense.
You can use the builder to get the dashboard foundation in place, export it to Excel, and then continue customizing the workbook if you need to.
What about the Pro version?
The builder has a trial option, which currently allows up to 6 widgets.
For my testing, I used the Pro version because I wanted access to the maximum available widgets and to explore the dashboard-building workflow without that limitation.
There is also a surprisingly inexpensive lifetime offer currently being promoted: $0.50 for lifetime Pro access.
And there is another part of the launch that caught my attention.
The first 500 Pro keys are being given away free.
At $0.50 per key, that represents $250 worth of Pro access in total.
If you want to claim one of the free keys, the current instruction is to send a DM.
https://www.facebook.com/Exceltricks007
Is this going to replace Excel?
No.
And I don’t think that is the right way to look at it.
Excel is still Excel.
It remains one of the most flexible tools for working with data, formulas, calculations, analysis, and reporting.
What a dashboard builder can potentially change is how you approach the dashboard creation part.
Instead of spending your time manually creating every visual element, you can start with templates and widgets and focus more of your time on the information the dashboard actually needs to communicate.
That distinction is important.
The goal isn’t to eliminate Excel.
The goal is to reduce the repetitive work involved in turning spreadsheet data into something people can actually understand.
Who could benefit from a dashboard builder?
I can see this workflow being particularly useful for people who regularly create:
- Sales dashboards
- Management reports
- KPI dashboards
- Business performance reports
- Monthly Excel reports
- Financial reporting dashboards
- Marketing dashboards
- Operations dashboards
- Team performance reports
- Client reporting dashboards
It could also be useful for Excel freelancers and consultants who repeatedly create similar dashboards for different clients.
Instead of rebuilding the same basic structure every time, starting with a template could give them a reusable foundation.
The bigger change isn’t the chart — it’s the workflow
There are hundreds of Excel tutorials showing you how to create a particular chart.
That’s not really the interesting part here.
The interesting part is the workflow.
Raw Excel data → Import → Template → Customize → Export → Excel dashboard
That is much closer to how people expect modern software to work.
You don’t necessarily need to know every formatting trick before you begin.
You don’t necessarily need to design the entire dashboard manually.
You start with something that already exists and modify it to fit your requirements.
For experienced Excel users, that could mean less repetitive work.
For beginners, it could make dashboard creation less intimidating.
And for people who build dashboards for other businesses, the time saved could be even more valuable.
My first impression
After testing the workflow, the biggest takeaway for me wasn’t one particular widget or chart.
It was how quickly you can move from raw data to a usable dashboard structure.
That is the part that makes this interesting.
Instead of spending the first part of the project deciding where every element should go, you can begin with a template and spend your time improving the actual dashboard.
Of course, the quality of the final dashboard will still depend on your data, the template you choose, and how you customize it.
A tool can’t replace good dashboard design.
It can, however, remove some of the repetitive work.
And that’s exactly why I think this is worth watching if you work with Excel dashboards regularly.
Want to try the Excel Dashboard Builder?
If you are tired of starting every dashboard from a blank Excel workbook, this is worth exploring.
The workflow is straightforward:
Upload your Excel data → review your columns → choose a template → customize your widgets → export to Excel.
I’m currently using the Pro version to explore the full widget experience.
The trial version allows up to 6 widgets, while the current Pro offer is being promoted at $0.50 for lifetime access.
More importantly, the first 500 Pro keys are being offered free as part of the launch.
If you want the free key, send a DM.
And if you want to explore the dashboard builder yourself, comment “BUILDER” and I’ll share the website link.
Final thought
Excel dashboards don’t have to begin with a blank sheet.
Sometimes the smarter approach is to start with a strong foundation and then make it your own.
That’s what makes this dashboard-building workflow interesting.
It doesn’t try to make Excel less powerful.
It simply tries to make one of the most time-consuming parts of Excel reporting — building the dashboard itself — much easier.
And if you’re someone who spends hours every week creating Excel dashboards, that difference could be worth a lot more than a few clicks.
Want to see the complete process?
Watch the video to see how raw Excel data is imported, turned into a dashboard using a template, customized with widgets, and exported back into an Excel workbook.
Comment “BUILDER” for the website link.


Pingback: MIN Function in Excel: Find the Lowest Value with Examples & Practice File - Excel AI Tools and SEO Guides
Builder