
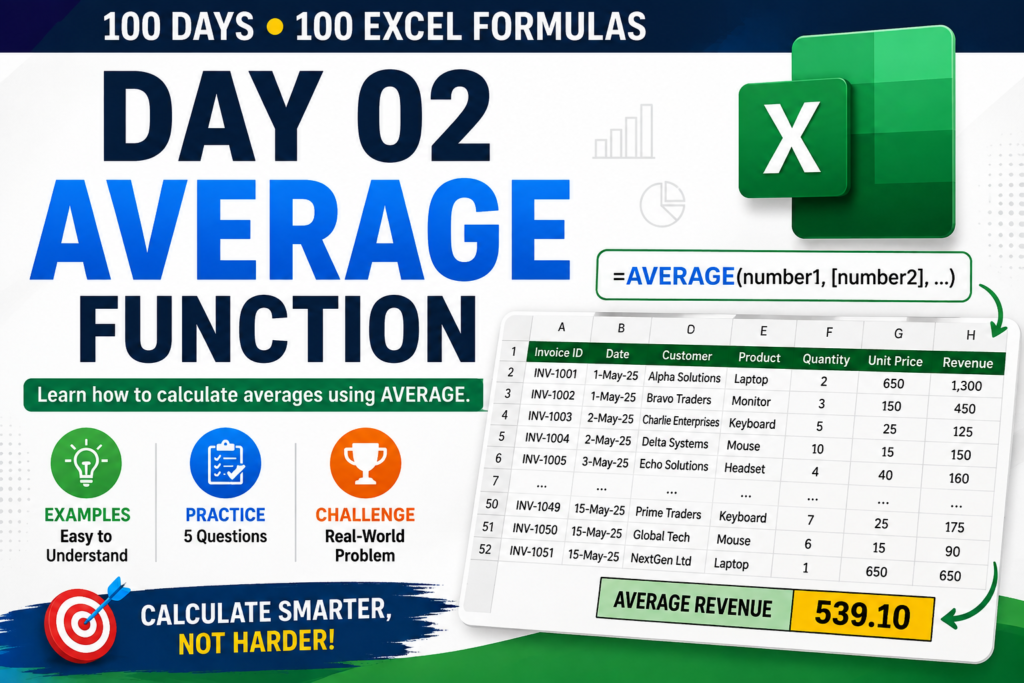

100 Days • 100 Excel Formulas — Day 2
Calculating a total is useful, but sometimes a total doesn’t tell the complete story.
For example, imagine you have 50 sales transactions. You know the total revenue, but what if you want to know how much revenue the business generates on average per transaction?
That’s where the AVERAGE function in Excel becomes useful.
In Day 2 of our 100 Days • 100 Excel Formulas series, you’ll learn how to use AVERAGE with a realistic sales dataset. We’ll calculate average quantity, average revenue, average unit price, a specific range, and even the average of two separate ranges.
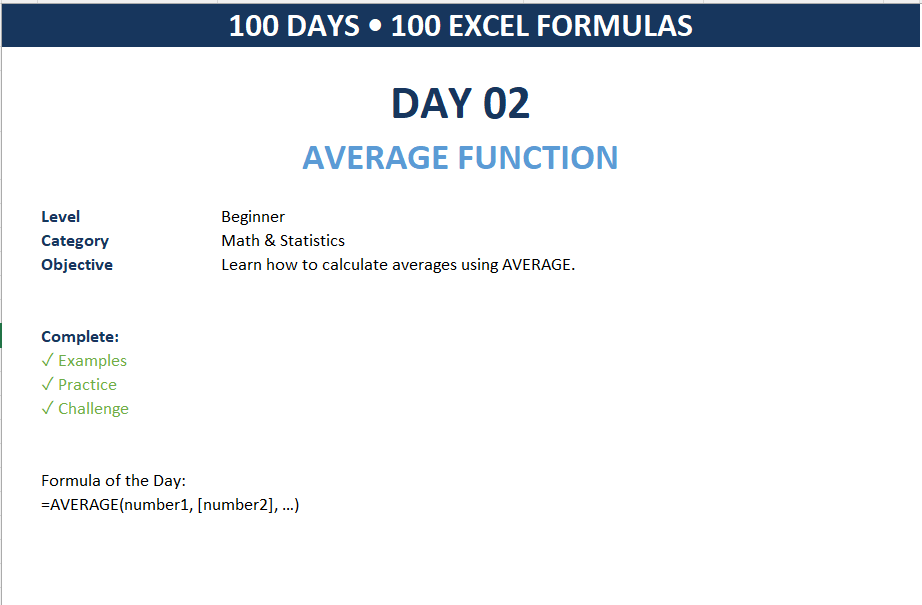
You’ll also get a free practice workbook with exercises, answers, and a real-world challenge.
Level: Beginner
Category: Math & Statistics
Formula: AVERAGE
What Is the AVERAGE Function in Excel?
The AVERAGE function calculates the arithmetic mean of a group of numbers.
In simple terms, Excel adds the numeric values and divides the result by the number of numeric values.
For example, suppose your sales quantities are:
10, 20, 30
The average is:
20
In Excel, you can calculate it with:
=AVERAGE(10,20,30)Or, if the numbers are stored in cells A2:A4:
=AVERAGE(A2:A4)This makes AVERAGE especially useful when working with sales reports, expenses, employee data, inventory, budgets, performance measurements, and other datasets.
AVERAGE Function Syntax
The basic syntax is:
=AVERAGE(number1, [number2], ...)You can use:
- Individual numbers
- Individual cells
- A continuous range
- Multiple ranges
For example:
=AVERAGE(B2:B10)calculates the average of the values in B2 through B10.
You can also use multiple ranges:
=AVERAGE(B2:B10,D2:D10)Excel calculates the average using the numeric values from both ranges.
Example 1: Calculate Average Quantity
Let’s use a practical sales dataset.
Suppose the Quantity column contains the number of products sold in each transaction.
If your quantity data is in cells F4:F53, use:
=AVERAGE(F4:F53)Excel calculates the average quantity represented by those 50 sales records.


This can answer a useful business question:
How many products are sold, on average, in each transaction?
Instead of manually calculating the result, Excel does the calculation for you.
Example 2: Calculate Average Sales Revenue
Now let’s calculate something more useful for a sales team.
Suppose the Revenue column is H4:H53.
Use:

=AVERAGE(H4:H53)This calculates the average revenue per sales transaction.
This metric can be useful when analyzing sales performance because total revenue alone doesn’t tell you how much revenue is generated by a typical transaction.
For example, a sales manager might compare average transaction revenue across different periods to understand whether the typical sale is becoming larger or smaller.

Example 3: Calculate Average Unit Price
You can also calculate the average unit price of the products in your dataset.
If Unit Price is in column G:

=AVERAGE(G4:G53)This returns the average of all numeric unit-price values in the selected range.
Remember that this is a simple average of the listed unit prices. It is not a quantity-weighted average price.
That distinction matters when you’re analyzing real sales data.

Example 4: Calculate the Average of a Specific Range
You don’t always need to calculate the average for the entire dataset.
Suppose you only want to calculate the average revenue for cells H4:H15.
Use:
=AVERAGE(H4:H15)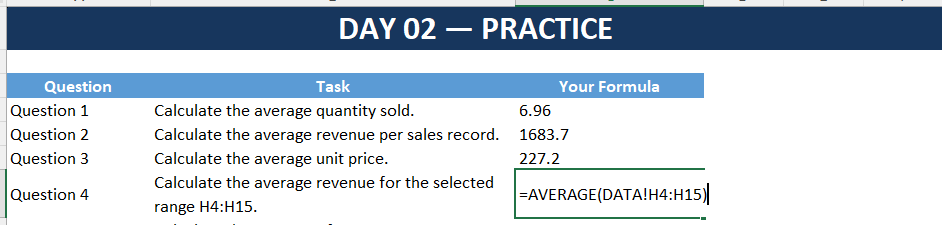
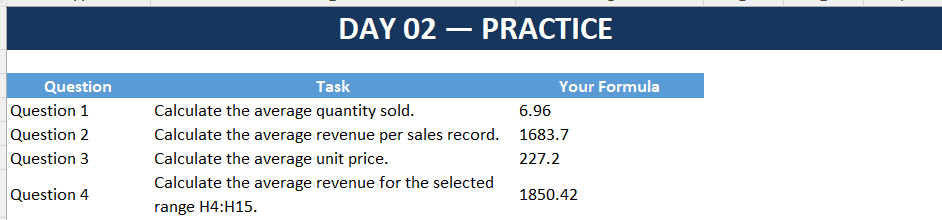
Excel calculates the average using only those selected cells.
This is useful when you’re analyzing:
- A particular group of transactions
- A selected reporting period
- A section of a worksheet
- A small sample of your dataset
The important thing is to make sure you select the correct range.
Example 5: Calculate an Average Using Two Separate Ranges
Here’s a slightly more advanced use of AVERAGE.
Suppose you want to calculate the average quantity from two separate ranges:
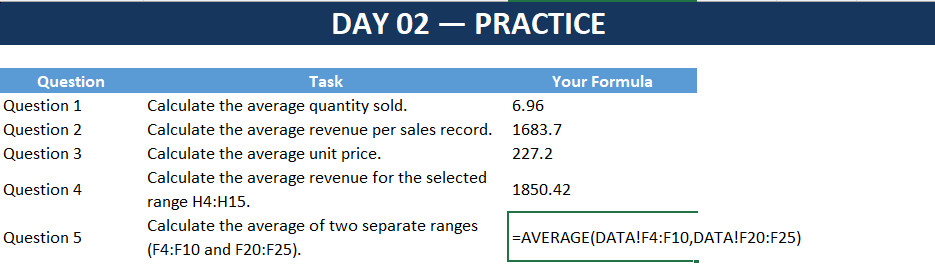
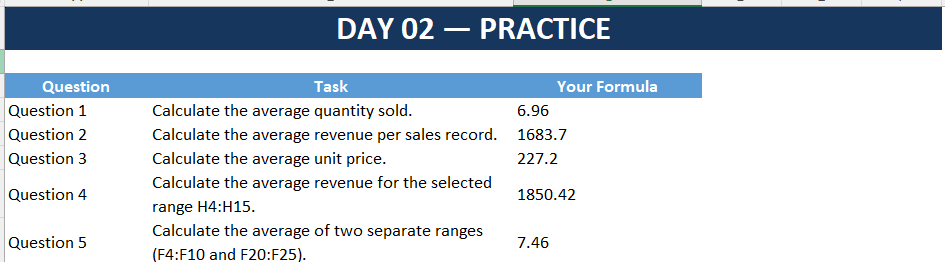
F4:F10 and F20:F25
You can use:
=AVERAGE(F4:F10,F20:F25)The comma separates the two ranges.
Excel uses the numeric values from both ranges to calculate the overall arithmetic mean.
This is particularly useful when the data you need isn’t located in one continuous section of your worksheet.
What Happens to Blank Cells and Text?
One useful feature of AVERAGE is how it handles different types of cell contents.
When you reference a range, blank cells and text contained in referenced cells are not included as numeric values in the calculation.
For example, if A1:A4 contains:
| Cell | Value |
|---|---|
| A1 | 10 |
| A2 | 20 |
| A3 | Blank |
| A4 | 30 |
Then:
=AVERAGE(A1:A4)returns:
20
The blank cell does not count as a numeric value.
However, you should still inspect your source data carefully. If numbers have been imported or stored incorrectly as text, your calculation may not represent what you intended.
AVERAGE vs SUM: What’s the Difference?
This is one of the most important concepts to understand.
SUM calculates a total.
=SUM(H4:H53)AVERAGE calculates the arithmetic mean.
=AVERAGE(H4:H53)Imagine your sales revenue values are:
100, 200, 300
SUM gives:
600
AVERAGE gives:
200
So remember:
SUM tells you the total. AVERAGE tells you the typical arithmetic value across the numeric values being averaged.
Both formulas are important, but they answer different business questions.
Common AVERAGE Mistakes
1. Selecting the wrong range
If your data ends at row 53 but you use:
=AVERAGE(H4:H45)then rows 46 through 53 won’t be included.
Always check the first and last cells in your range.
2. Confusing average revenue with total revenue
These formulas answer different questions:
=SUM(H4:H53)calculates total revenue.
=AVERAGE(H4:H53)calculates average revenue per numeric value in the range.
3. Forgetting that zeros are values
A zero is a numeric value.
If a range contains zeros, those zeros can affect the average.
For example:
100
200
0
The average is:
100
not 150.
So before calculating an average, understand what the zero values represent.
4. Using an average when a weighted average is required
Suppose one product was sold once at $1,000 and another product was sold 100 times at $10.
A simple average of the two unit prices doesn’t represent the average price paid across all units.
In situations like this, you may need a weighted average instead.
That’s an important distinction when working with real business data.
📥 Download the Day 2 Practice Workbook
To make this lesson hands-on, use the Day 2 AVERAGE Practice Workbook.
It contains five sheets:
1. START HERE
A quick introduction to Day 2, including the learning objective and formula syntax.
2. DATA
A realistic 50-record sales dataset containing:
- Invoice ID
- Date
- Customer
- Region
- Product
- Quantity
- Unit Price
- Revenue
3. PRACTICE
Five exercises designed to help you apply AVERAGE.
4. ANSWERS
Correct formulas and explanations so you can check your work.
5. CHALLENGE
A real-world sales-analysis problem.
📝 Day 2 Practice Questions
Try these questions yourself before checking the answers.
Question 1
Calculate the average quantity sold.
Use the Quantity column.
=AVERAGE(F4:F53)Question 2
Calculate the average revenue per sales record.
=AVERAGE(H4:H53)Question 3
Calculate the average unit price.
=AVERAGE(G4:G53)Question 4
Calculate the average revenue for the selected range H4:H15.
=AVERAGE(H4:H15)Question 5
Calculate the average of two separate ranges: F4:F10 and F20:F25.
=AVERAGE(F4:F10,F20:F25)Try solving all five questions before looking at the Answers sheet.
🔥 Day 2 Real-World Challenge
Now let’s put your new skill to the test.
Imagine you’re working as a sales analyst.
Your manager gives you the sales report and asks:
“What is the average revenue generated per sales transaction?”
There’s one rule:
Calculate it using ONE Excel formula.
Don’t manually add the values.
Don’t use a calculator.
Use the AVERAGE function.
Look at the Revenue column in the Data sheet and calculate the average.
Can you solve it?
Pause here and try it yourself.
Then write your formula in the comments.
This is the difference between simply watching an Excel tutorial and actually learning how to use Excel.
Frequently Asked Questions About AVERAGE in Excel
1. What does the AVERAGE function do in Excel?
AVERAGE calculates the arithmetic mean of numeric values.
For example:
=AVERAGE(10,20,30)returns 20.
2. What is the formula for average in Excel?
The basic formula is:
=AVERAGE(range)For example:
=AVERAGE(A2:A10)3. Does AVERAGE include blank cells?
Blank cells in a referenced range are not counted as numeric values when Excel calculates the average.
However, always check your dataset to make sure missing values are being handled as intended.
4. Does AVERAGE include zero?
Yes. Zero is a numeric value and can affect the result.
For example:
10
20
0
has an average of 10.
5. Can AVERAGE work with multiple ranges?
Yes.
For example:
=AVERAGE(A2:A10,C2:C10)calculates the average using the numeric values from both ranges.
6. What is the difference between SUM and AVERAGE?
SUM calculates the total of numeric values.
AVERAGE calculates their arithmetic mean.
For example, if your values are 10, 20, and 30:
=SUM(A1:A3)returns 60.
=AVERAGE(A1:A3)returns 20.
7. Why is my AVERAGE formula giving an unexpected result?
Check the source range first.
Look for:
- Incorrect cell references
- Unexpected zeros
- Numbers stored as text
- Missing values
- Data outside the selected range
The formula may be correct while the source data or selected range is not what you intended.
8. Can I calculate the average of sales revenue?
Yes.
If your revenue values are in H4:H53:
=AVERAGE(H4:H53)This calculates the average revenue per numeric value in that range.
9. Is AVERAGE available in Microsoft Excel 365?
Yes. AVERAGE is a standard Excel function and is available in Microsoft Excel, including Microsoft 365.
It is one of the fundamental statistical functions that beginners should learn.
10. What should I learn after AVERAGE?
Once you understand AVERAGE, continue with other fundamental functions such as:
MIN — find the smallest value.
MAX — find the largest value.
COUNT — count numeric values.
COUNTIF — count values that meet a condition.
SUMIF — calculate totals based on a condition.
These functions become increasingly useful when you start analyzing real-world Excel datasets.
AVERAGE Function Cheat Sheet
| Task | Formula |
|---|---|
| Average a range | =AVERAGE(A1:A10) |
| Average individual values | =AVERAGE(10,20,30) |
| Average two ranges | =AVERAGE(A1:A10,C1:C10) |
| Average quantity | =AVERAGE(F4:F53) |
| Average revenue | =AVERAGE(H4:H53) |
| Average unit price | =AVERAGE(G4:G53) |
| Average selected revenue | =AVERAGE(H4:H15) |
What You Learned Today
By completing Day 2, you should now be able to:
- Understand what AVERAGE does
- Calculate the average of a range
- Calculate average quantity
- Calculate average revenue
- Calculate average unit price
- Calculate an average from a specific range
- Calculate an average from multiple ranges
- Understand how blanks and zeros affect averages
- Recognize when a simple average may not be appropriate
- Apply AVERAGE to a real-world sales dataset
The key formula to remember is:
=AVERAGE(range)What’s Next?
You’ve now learned two fundamental Excel formulas.
Day 1 → SUM → Calculate totals
Day 2 → AVERAGE → Calculate averages
Next, we’ll learn how to identify the smallest value in a dataset.
Day 3: MIN Function in Excel
We’ll use another practical dataset to find the lowest quantity, lowest price, and other minimum values—and finish with another real-world challenge.
The goal of this series is simple:
Learn → Practice → Apply → Master Excel
Don’t just read the formula.
Open the workbook.
Try the questions.
Complete the challenge.
Then move on to Day 3.


Pingback: I Stopped Building Excel Dashboards From Scratch — Here’s the Tool I’m Using Instead - Excel AI Tools and SEO Guides