
Inventory Management:- Businesses generate thousands of inventory transactions every month.
Products move in and out of warehouses, suppliers deliver stock, sales teams generate revenue, and managers try to make sense of endless spreadsheets.
The problem?
Most inventory data sits inside Excel sheets without delivering meaningful business insights.
A spreadsheet can tell you what happened.
A dashboard can tell you why it happened and what to do next.
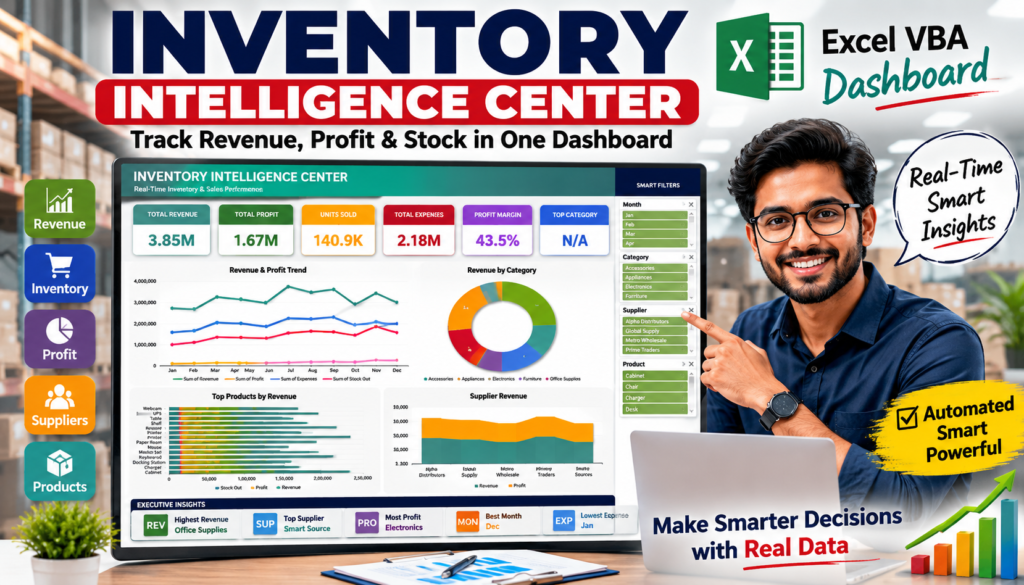
That’s exactly why I built the Inventory Intelligence Center, a fully automated Excel VBA dashboard designed to transform raw inventory data into actionable business intelligence.
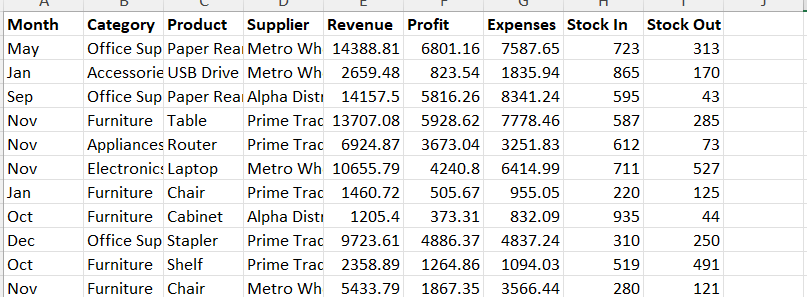
Using a simple dataset containing Month, Category, Product, Supplier, Revenue, Profit, Expenses, Stock In, and Stock Out information, the dashboard automatically creates executive-level insights that help businesses monitor performance, improve profitability, and make smarter decisions.
Why Inventory Visibility Matters More Than Ever
Inventory management is no longer just about tracking stock levels.
Modern businesses must answer questions like:
- Which product generates the highest revenue?
- Which category delivers the best profit margin?
- Which supplier contributes the most value?
- Are inventory levels increasing faster than sales?
- Which month performs best?
- Where are expenses reducing profitability?
Without clear visibility, companies often face:
- Overstocking
- Stock shortages
- Reduced cash flow
- Poor purchasing decisions
- Lower profit margins
- Delayed reporting
The Inventory Intelligence Center solves these challenges by converting raw inventory records into real-time visual insights.
From Raw Data to Business Intelligence
The dashboard starts with a simple inventory table.
Typical data includes:
Most businesses stop here.
But this dashboard automatically transforms these records into interactive reports, KPI cards, charts, slicers, and executive insights.
No manual Pivot Table creation.
No repetitive reporting.
No complicated formulas.
Just one click.
Executive Dashboard at First Glance
When users open the Inventory Intelligence Center, they immediately see the most important business metrics.
Total Revenue
Revenue provides an instant overview of business performance.
The dashboard automatically calculates overall sales generated from all inventory transactions.
Instead of filtering rows or creating formulas manually, users can instantly see how much revenue the business has generated.
Total Profit
Revenue alone doesn’t tell the whole story.
Profit determines business success.
The dashboard tracks total profit and highlights overall profitability across all products and categories.
This allows business owners to understand whether growth is actually generating value.
Units Sold
Inventory movement is critical.
The dashboard calculates total units sold and provides immediate visibility into demand patterns.
Businesses can quickly identify whether inventory turnover is improving or slowing down.
Total Expenses
Expenses directly impact profitability.
Tracking operational costs is essential for sustainable growth.
The dashboard automatically summarizes expenses and displays them alongside revenue and profit for complete financial visibility.
Profit Margin
One of the most important KPIs in inventory management is profit margin.
The dashboard automatically calculates profit margin percentages, helping users evaluate efficiency rather than simply focusing on sales volume.
A business generating higher margins often performs better than one generating higher revenue with excessive costs.
Revenue and Profit Trend Analysis
One of the most powerful features is the Revenue & Profit Trend chart.
This visualization helps identify performance patterns throughout the year.
Instead of reviewing monthly reports individually, users can instantly spot:
- Revenue growth trends
- Profit fluctuations
- Expense changes
- Stock-out patterns
This information helps management answer critical questions.
Is revenue growing consistently?
A rising trend indicates healthy business growth.
Are expenses increasing too quickly?
Expense spikes can highlight operational inefficiencies.
Which months perform best?
Seasonal demand becomes visible immediately.
Are profits keeping pace with revenue?
Revenue growth without profit growth may indicate pricing or cost issues.
The chart transforms static numbers into meaningful business insights.
Revenue by Category: Understanding What Drives Sales
Not all product categories contribute equally.
Some categories generate most of the revenue while others consume resources without delivering significant returns.
The Revenue by Category visualization automatically breaks down sales performance across categories such as:
- Electronics
- Furniture
- Appliances
- Accessories
- Office Supplies
This allows decision-makers to identify:
Top Revenue Categories
Understanding where revenue originates helps allocate resources effectively.
Underperforming Categories
Poor-performing categories can be reviewed for optimization.
Growth Opportunities
Categories showing strong momentum can receive additional investment.
This level of visibility is often unavailable in traditional inventory reports.
Product Performance Ranking
Every inventory manager wants to know one thing:
Which products make the most money?
The Top Products by Revenue chart answers that question immediately.
Products are automatically ranked based on performance.
Benefits include:
- Identifying best sellers
- Monitoring demand trends
- Optimizing stock levels
- Improving purchasing decisions
- Increasing inventory turnover
Rather than guessing which products deserve attention, businesses can use actual performance data.
This significantly improves inventory planning.
Supplier Performance Insights
Suppliers play a major role in inventory success.
A reliable supplier can improve profitability.
An inefficient supplier can create stock shortages and operational challenges.
The Supplier Revenue section tracks supplier performance using revenue and profit metrics.
Management can evaluate:
- Revenue generated per supplier
- Profit contribution
- Supplier dependency
- Purchasing efficiency
These insights support better supplier negotiations and procurement strategies.
Businesses can focus on vendors delivering the highest value.
Inventory Flow Monitoring
Inventory movement directly impacts cash flow.
The Inventory Flow section visualizes:
Stock In
Products entering inventory.
Stock Out
Products leaving inventory through sales or usage.
Tracking these movements helps businesses identify:
- Overstock situations
- Fast-moving products
- Inventory shortages
- Replenishment requirements
Instead of waiting for monthly inventory reviews, managers can monitor stock activity continuously.
Revenue vs Expenses: The True Profitability Indicator
Many businesses focus only on sales numbers.
The problem is simple:
High revenue doesn’t always mean high profit.
The Revenue vs Expenses chart helps businesses evaluate financial performance more accurately.
Users can instantly compare:
- Revenue
- Expenses
- Profit contribution
This helps identify:
- Cost-control opportunities
- Margin improvements
- Expense spikes
- Operational inefficiencies
Data-driven decisions become significantly easier when financial performance is visualized clearly.
Executive Insights: Automated Business Intelligence
Perhaps the most powerful feature of the Inventory Intelligence Center is the Executive Insights section.
Instead of manually analyzing multiple reports, the dashboard automatically identifies key findings.
Examples include:
Highest Revenue Category
Shows the category generating maximum sales.
Best Performing Product
Highlights the strongest product based on revenue.
Top Supplier
Identifies the supplier contributing the most business value.
Most Profitable Category
Reveals which category delivers the highest profit.
Best Revenue Month
Highlights peak sales periods.
Lowest Expense Month
Shows periods of operational efficiency.
These insights provide immediate executive-level decision support.
Interactive Filtering for Instant Analysis
Modern dashboards must be interactive.
That’s why the Inventory Intelligence Center includes smart slicers for:
- Month
- Category
- Supplier
- Product
Users can click a filter and instantly update:
- KPI cards
- Charts
- Rankings
- Executive insights
No formulas need to be edited.
No Pivot Tables need to be refreshed manually.
Everything updates automatically.
Why Excel VBA Is Still a Powerful Business Tool
Many organizations believe advanced analytics requires expensive software.
In reality, Excel VBA remains one of the most powerful business intelligence tools because it offers:
Affordability
No costly software subscriptions.
Flexibility
Dashboards can be customized for any business.
Automation
Reduces manual reporting effort.
Familiar Interface
Most teams already use Excel.
Scalability
Handles thousands of inventory transactions efficiently.
For small and medium-sized businesses, VBA dashboards provide enterprise-level reporting without enterprise-level costs.
The Future of Inventory Management
Businesses that rely on manual reporting will struggle to compete.
The future belongs to organizations that can:
- Analyze data faster
- Identify trends earlier
- Improve inventory turnover
- Reduce operational costs
- Increase profitability
Inventory intelligence is no longer optional.
It is becoming a competitive advantage.
The Inventory Intelligence Center demonstrates how Excel can evolve from a simple spreadsheet application into a complete business intelligence platform.
VBA Code
Option Explicit
' =============================================================================
' INVENTORY INTELLIGENCE CENTER v7.0 - PREMIUM EDITION (FIXED)
' Fixes vs v6:
' 1. Insights panel & small charts were overlapping (both started at the
' same row). Insights now has its own dedicated band (rows 51-59);
' small charts moved to a NEW band below (rows 61-79). Footer and total
' sheet height shifted down accordingly so nothing collides.
' 2. Slicers had excess empty space below items + looked flat/uncolored.
' Height is now calculated from the ACTUAL item count per field
' (capped sensibly). Styling uses the genuine built-in slicer style
' "SlicerStyleDark3" (a real, verified Excel constant string) for
' strong dark/navy contrast -- no fabricated SlicerStyle/TableStyle
' objects are used, since those do not exist in the VBA object model.
' 3. Large charts (Top Products, etc.) felt cramped with many bars/labels.
' Chart row bands heightened and category-axis fonts tightened so bars
' render thicker and more professional.
' =============================================================================
Private Const SHEET_DATA As String = "Data"
Private Const SHEET_PIVOT As String = "PivotData"
Private Const SHEET_DASHBOARD As String = "Dashboard"
Private Const COL_MONTH As String = "Month"
Private Const COL_CATEGORY As String = "Category"
Private Const COL_PRODUCT As String = "Product"
Private Const COL_SUPPLIER As String = "Supplier"
Private Const COL_REVENUE As String = "Revenue"
Private Const COL_PROFIT As String = "Profit"
Private Const COL_EXPENSES As String = "Expenses"
Private Const COL_STOCKIN As String = "Stock In"
Private Const COL_STOCKOUT As String = "Stock Out"
Private Function C(r As Integer, g As Integer, b As Integer) As Long
C = RGB(r, g, b)
End Function
' =============================================================================
' MAIN
' =============================================================================
Public Sub BuildInventoryIntelligenceCenter()
Dim wb As Workbook, wsData As Worksheet
Dim wsPivot As Worksheet, wsDash As Worksheet
Dim T As Double: T = Timer
On Error GoTo ErrHandler
Application.ScreenUpdating = False
Application.Calculation = xlCalculationManual
Application.DisplayAlerts = False
Application.EnableEvents = False
Set wb = ThisWorkbook
Set wsData = GetWS(SHEET_DATA)
If wsData Is Nothing Then
MsgBox "Sheet 'Data' not found!", vbCritical, "IIC": GoTo CleanUp
End If
If Not ValidateHeaders(wsData) Then GoTo CleanUp
DeleteAssets wb
Set wsPivot = wb.Worksheets.Add
wsPivot.Name = SHEET_PIVOT
BuildAllPivots wb, wsData, wsPivot
' Force calculation so pivot ranges are real before we read them
Application.Calculation = xlCalculationAutomatic
wb.RefreshAll
Application.Calculate
Application.Calculation = xlCalculationManual
wsPivot.Columns.AutoFit
wsPivot.Tab.Color = C(0, 137, 123)
Set wsDash = wb.Worksheets.Add(Before:=wb.Sheets(1))
wsDash.Name = SHEET_DASHBOARD
BuildLayout wsDash
BuildKPICards wsDash, wsPivot
BuildCharts wsDash, wsPivot
BuildSlicers wb, wsDash, wsPivot
BuildInsights wsDash, wsPivot
FinalPolish wsDash, wsPivot
On Error Resume Next
Application.Calculation = xlCalculationAutomatic
wb.RefreshAll
Application.Calculate
On Error GoTo 0
MsgBox "Inventory Intelligence Center v6.0 Ready!" & vbLf & _
"Build time: " & Format(Timer - T, "0.0") & "s", _
vbInformation, "IIC"
CleanUp:
Application.ScreenUpdating = True
Application.Calculation = xlCalculationAutomatic
Application.DisplayAlerts = True
Application.EnableEvents = True
Exit Sub
ErrHandler:
Application.ScreenUpdating = True
Application.Calculation = xlCalculationAutomatic
Application.DisplayAlerts = True
Application.EnableEvents = True
MsgBox "Error " & Err.Number & ": " & Err.Description, vbCritical, "IIC"
Resume CleanUp
End Sub
' =============================================================================
' VALIDATE HEADERS
' =============================================================================
Private Function ValidateHeaders(ws As Worksheet) As Boolean
Dim cols() As String
cols = Split(COL_MONTH & "," & COL_CATEGORY & "," & COL_PRODUCT & "," & _
COL_SUPPLIER & "," & COL_REVENUE & "," & COL_PROFIT & "," & _
COL_EXPENSES & "," & COL_STOCKIN & "," & COL_STOCKOUT, ",")
Dim lastCol As Long: lastCol = GetLastCol(ws, 1)
Dim missing As String, i As Integer, j As Long, found As Boolean
For i = 0 To UBound(cols)
found = False
For j = 1 To lastCol
If Trim(ws.Cells(1, j).Value) = Trim(cols(i)) Then found = True: Exit For
Next j
If Not found Then missing = missing & " - " & cols(i) & vbLf
Next i
If Len(missing) > 0 Then
MsgBox "Missing columns:" & vbLf & missing, vbCritical, "IIC"
ValidateHeaders = False
Else
ValidateHeaders = True
End If
End Function
' =============================================================================
' DELETE ASSETS
' =============================================================================
Private Sub DeleteAssets(wb As Workbook)
On Error Resume Next
Dim sc As SlicerCache
For Each sc In wb.SlicerCaches: sc.Delete: Next sc
Dim ws As Worksheet
For Each ws In wb.Worksheets
If ws.Name = SHEET_DASHBOARD Or ws.Name = SHEET_PIVOT Then ws.Delete
Next ws
On Error GoTo 0
End Sub
' =============================================================================
' BUILD PIVOT TABLES
' Pivots are spaced 40 rows apart (instead of cramped) so each one always
' has plenty of room regardless of how many categories/products exist.
' =============================================================================
Private Sub BuildAllPivots(wb As Workbook, wsData As Worksheet, wsPivot As Worksheet)
Dim lastRow As Long: lastRow = GetLastRow(wsData, 1)
Dim lastCol As Long: lastCol = GetLastCol(wsData, 1)
Dim pc As PivotCache
Set pc = wb.PivotCaches.Create(xlDatabase, _
wsData.Range(wsData.Cells(1, 1), wsData.Cells(lastRow, lastCol)))
Dim pt As PivotTable
Set pt = MakePT(pc, wsPivot, "A1", "PT_SalesTrend")
pt.PivotFields(COL_MONTH).Orientation = xlRowField
AddDF pt, COL_REVENUE, "Sum of Revenue"
AddDF pt, COL_PROFIT, "Sum of Profit"
AddDF pt, COL_EXPENSES, "Sum of Expenses"
AddDF pt, COL_STOCKOUT, "Sum of Stock Out"
Set pt = MakePT(pc, wsPivot, "A40", "PT_CategoryAnalysis")
pt.PivotFields(COL_CATEGORY).Orientation = xlRowField
AddDF pt, COL_REVENUE, "Sum of Revenue"
AddDF pt, COL_PROFIT, "Sum of Profit"
Set pt = MakePT(pc, wsPivot, "A70", "PT_ProductRanking")
pt.PivotFields(COL_PRODUCT).Orientation = xlRowField
AddDF pt, COL_REVENUE, "Sum of Revenue"
AddDF pt, COL_PROFIT, "Sum of Profit"
AddDF pt, COL_STOCKOUT, "Sum of Stock Out"
Set pt = MakePT(pc, wsPivot, "A130", "PT_SupplierPerformance")
pt.PivotFields(COL_SUPPLIER).Orientation = xlRowField
AddDF pt, COL_REVENUE, "Sum of Revenue"
AddDF pt, COL_PROFIT, "Sum of Profit"
Set pt = MakePT(pc, wsPivot, "A160", "PT_InventoryFlow")
pt.PivotFields(COL_MONTH).Orientation = xlRowField
AddDF pt, COL_STOCKIN, "Sum of Stock In"
AddDF pt, COL_STOCKOUT, "Sum of Stock Out"
Set pt = MakePT(pc, wsPivot, "A190", "PT_Profitability")
pt.PivotFields(COL_CATEGORY).Orientation = xlRowField
AddDF pt, COL_PROFIT, "Sum of Profit"
End Sub
Private Function MakePT(pc As PivotCache, ws As Worksheet, _
addr As String, ptName As String) As PivotTable
On Error Resume Next
Dim pt As PivotTable
Set pt = pc.CreatePivotTable(TableDestination:=ws.Range(addr), TableName:=ptName)
If Not pt Is Nothing Then
pt.TableStyle2 = "PivotStyleMedium9"
pt.ShowDrillIndicators = False
pt.DisplayFieldCaptions = False
pt.ColumnGrand = True
pt.RowGrand = False
End If
Set MakePT = pt
On Error GoTo 0
End Function
Private Sub AddDF(pt As PivotTable, fld As String, cap As String)
On Error Resume Next
Dim df As PivotField
Set df = pt.AddDataField(pt.PivotFields(fld), cap, xlSum)
If Not df Is Nothing Then df.NumberFormat = "#,##0"
On Error GoTo 0
End Sub
' =============================================================================
' DASHBOARD LAYOUT
' =============================================================================
Private Sub BuildLayout(ws As Worksheet)
ws.Cells.Interior.Color = C(244, 246, 251)
ws.Rows(1).RowHeight = 5
ws.Rows(2).RowHeight = 54
ws.Rows(3).RowHeight = 16
ws.Rows(4).RowHeight = 8
ws.Rows(5).RowHeight = 6
Dim r As Long
For r = 6 To 14: ws.Rows(r).RowHeight = 13: Next r
ws.Rows(15).RowHeight = 10
For r = 16 To 33: ws.Rows(r).RowHeight = 14.5: Next r
ws.Rows(34).RowHeight = 6
For r = 35 To 49: ws.Rows(r).RowHeight = 16: Next r
ws.Rows(50).RowHeight = 6
' Insights band: rows 51-59 (dedicated, nothing else here)
For r = 51 To 59: ws.Rows(r).RowHeight = 15: Next r
ws.Rows(60).RowHeight = 8 ' spacer between insights and small charts
' Small-charts band: rows 61-79 (separate from insights)
For r = 61 To 79: ws.Rows(r).RowHeight = 14.5: Next r
ws.Rows(80).RowHeight = 6
ws.Rows(81).RowHeight = 22 ' footer
Dim col As Long
For col = 1 To 24: ws.Columns(col).ColumnWidth = 7.5: Next col
For col = 25 To 28: ws.Columns(col).ColumnWidth = 8.8: Next col
ws.Range("Y1:AB81").Interior.Color = C(22, 40, 70)
With ws.Range("A2:X2")
.Merge
.Value = " INVENTORY INTELLIGENCE CENTER"
.Interior.Color = RGB(0, 137, 123)
.Font.Name = "Calibri": .Font.Size = 22
.Font.Bold = True: .Font.Color = RGB(245, 247, 245)
.VerticalAlignment = xlVAlignCenter
.HorizontalAlignment = xlHAlignLeft
End With
With ws.Range("Y2:AB2")
.Interior.Color = RGB(0, 137, 123)
End With
With ws.Range("A4:X4")
.Merge
.Value = "Last refreshed: " & Format(Now, "dd-mmm-yyyy hh:mm")
.Interior.Color = C(244, 246, 251)
.Font.Name = "Calibri": .Font.Size = 7
.Font.Italic = True: .Font.Color = C(100, 110, 130)
.HorizontalAlignment = xlHAlignRight
.VerticalAlignment = xlVAlignCenter
End With
With ws.Range("A3:X3")
.Merge
.Value = " Real-Time Inventory & Sales Performance | Powered by Excel Tricks"
.Interior.Color = C(123, 137, 123)
.Font.Name = "Calibri": .Font.Size = 8
.Font.Color = RGB(255, 255, 255)
.VerticalAlignment = xlVAlignCenter
.HorizontalAlignment = xlHAlignLeft
End With
With ws.Range("Y3:AB3")
.Interior.Color = C(0, 137, 123)
End With
With ws.Range("A81:AB81")
.Merge
.Value = " INVENTORY INTELLIGENCE CENTER | Enterprise VBA Dashboard | " & _
Format(Now, "dd-mmm-yyyy hh:mm")
.Interior.Color = C(13, 27, 42)
.Font.Name = "Calibri": .Font.Size = 8
.Font.Color = RGB(255, 255, 255)
.VerticalAlignment = xlVAlignCenter
End With
End Sub
' =============================================================================
' KPI CARDS
' FIX: NumberFormat is now applied ONLY for numeric cards, and AFTER value
' population (never "@" before a formula is written -> that bug forced
' Excel to store formulas as literal text instead of evaluating them).
' =============================================================================
Private Sub BuildKPICards(wsDash As Worksheet, wsPivot As Worksheet)
Dim titles(1 To 6) As String
Dim colors(1 To 6) As Long
Dim cStart(1 To 6) As Integer
titles(1) = "TOTAL REVENUE": colors(1) = C(0, 137, 123)
titles(2) = "TOTAL PROFIT": colors(2) = C(46, 125, 50)
titles(3) = "UNITS SOLD": colors(3) = C(249, 168, 37)
titles(4) = "TOTAL EXPENSES": colors(4) = C(183, 28, 28)
titles(5) = "PROFIT MARGIN": colors(5) = C(106, 27, 154)
titles(6) = "TOP CATEGORY": colors(6) = C(21, 101, 192)
cStart(1) = 1: cStart(2) = 5: cStart(3) = 9
cStart(4) = 13: cStart(5) = 17: cStart(6) = 21
Dim i As Integer
For i = 1 To 6
Dim c1 As Integer: c1 = cStart(i)
Dim c2 As Integer: c2 = c1 + 3
Dim L As Double: L = wsDash.Cells(6, c1).Left + 5
Dim T As Double: T = wsDash.Cells(6, c1).Top + 3
Dim W As Double: W = wsDash.Range(wsDash.Cells(6, c1), wsDash.Cells(6, c2)).Width - 10
Dim Hh As Double: Hh = wsDash.Range(wsDash.Cells(6, c1), wsDash.Cells(14, c1)).Height - 6
Dim shShadow As Shape
Set shShadow = wsDash.Shapes.AddShape(msoShapeRoundedRectangle, L + 3, T + 3, W, Hh)
With shShadow
.Fill.ForeColor.RGB = C(190, 200, 220)
.Fill.Solid
.Line.Visible = msoFalse
.Name = "Shadow_" & i
.ZOrder msoSendToBack
End With
Dim shCard As Shape
Set shCard = wsDash.Shapes.AddShape(msoShapeRoundedRectangle, L, T, W, Hh)
With shCard
.Fill.ForeColor.RGB = RGB(255, 255, 255)
.Fill.Solid
.Line.ForeColor.RGB = colors(i)
.Line.Weight = 1.25
.Line.Visible = msoTrue
.Name = "Card_" & i
On Error Resume Next
.Adjustments(1) = 0.07
On Error GoTo 0
End With
Dim Hdr As Double: Hdr = Hh * 0.38
Dim shHdr As Shape
Set shHdr = wsDash.Shapes.AddShape(msoShapeRoundedRectangle, L, T, W, Hdr)
With shHdr
.Fill.ForeColor.RGB = colors(i)
.Fill.Solid
.Line.Visible = msoFalse
.Name = "Hdr_" & i
On Error Resume Next
.Adjustments(1) = 0.12
On Error GoTo 0
.TextFrame.Characters.Text = titles(i)
With .TextFrame.Characters.Font
.Name = "Calibri"
.Size = 8
.Bold = True
.Color = RGB(255, 255, 255)
End With
.TextFrame.HorizontalAlignment = xlHAlignCenter
.TextFrame.VerticalAlignment = xlVAlignCenter
End With
Dim Tval As Double: Tval = T + Hdr
Dim Hval As Double: Hval = Hh - Hdr
Dim shVal As Shape
Set shVal = wsDash.Shapes.AddTextbox(msoTextOrientationHorizontal, L, Tval, W, Hval)
With shVal
.Fill.Visible = msoFalse
.Line.Visible = msoFalse
.Name = "Val_" & i
.TextFrame.Characters.Text = "..."
With .TextFrame
.HorizontalAlignment = xlHAlignCenter
.VerticalAlignment = xlVAlignCenter
.Characters.Font.Name = "Calibri"
.Characters.Font.Size = 17
.Characters.Font.Bold = True
.Characters.Font.Color = colors(i)
End With
End With
' Helper cell: GENERAL format, formula written first, format set after
Dim vc As Range: Set vc = wsDash.Cells(6 + i, 25)
vc.NumberFormat = "General"
vc.ClearContents
Next i
' Now write all formulas using GETPIVOTDATA against the live pivot
Dim pv As String: pv = wsPivot.Name
Dim anchor As String: anchor = pv & "!$A$3" ' first data cell area of PT_SalesTrend
On Error Resume Next
wsDash.Cells(7, 25).Formula = "=IFERROR(GETPIVOTDATA(""Sum of Revenue""," & pv & "!$A$1),0)"
wsDash.Cells(8, 25).Formula = "=IFERROR(GETPIVOTDATA(""Sum of Profit""," & pv & "!$A$1),0)"
wsDash.Cells(9, 25).Formula = "=IFERROR(GETPIVOTDATA(""Sum of Stock Out""," & pv & "!$A$1),0)"
wsDash.Cells(10, 25).Formula = "=IFERROR(GETPIVOTDATA(""Sum of Expenses""," & pv & "!$A$1),0)"
wsDash.Cells(11, 25).Formula = "=IFERROR(IF(GETPIVOTDATA(""Sum of Revenue""," & pv & "!$A$1)=0,0," & _
"GETPIVOTDATA(""Sum of Profit""," & pv & "!$A$1)" & _
"/GETPIVOTDATA(""Sum of Revenue""," & pv & "!$A$1)),0)"
' Top category: use the Category pivot table's own range dynamically
Dim ptCat As PivotTable
Set ptCat = wsPivot.PivotTables("PT_CategoryAnalysis")
Dim catLabelRange As String, catRevRange As String
catLabelRange = ptCat.PivotFields(COL_CATEGORY).DataRange.Address(False, False, xlA1, True)
catRevRange = ptCat.DataBodyRange.Columns(1).Address(False, False, xlA1, True)
wsDash.Cells(12, 25).Formula = "=IFERROR(INDEX(" & pv & "!" & catLabelRange & _
",MATCH(MAX(" & pv & "!" & catRevRange & ")," & pv & "!" & catRevRange & ",0)),""N/A"")"
On Error GoTo 0
wsDash.Range(wsDash.Cells(7, 25), wsDash.Cells(11, 25)).NumberFormat = "0.##########"
End Sub
' Called after RefreshAll to fill shape value textboxes
Private Sub PopulateKPIValues(wsDash As Worksheet)
Dim colors(1 To 6) As Long
colors(1) = C(0, 137, 123): colors(2) = C(46, 125, 50)
colors(3) = C(249, 168, 37): colors(4) = C(183, 28, 28)
colors(5) = C(106, 27, 154): colors(6) = C(21, 101, 192)
Dim i As Integer
For i = 1 To 6
Dim vc As Range
Set vc = wsDash.Cells(6 + i, 25)
Dim displayVal As String
On Error Resume Next
If i = 6 Then
displayVal = CStr(vc.Value)
If displayVal = "" Then displayVal = "N/A"
ElseIf i = 5 Then
displayVal = Format(vc.Value * 100, "0.0") & "%"
Else
Dim v As Double: v = vc.Value
If v >= 1000000 Then
displayVal = Format(v / 1000000, "0.00") & "M"
ElseIf v >= 1000 Then
displayVal = Format(v / 1000, "0.0") & "K"
Else
displayVal = Format(v, "#,##0")
End If
End If
On Error GoTo 0
On Error Resume Next
Dim shVal As Shape
Set shVal = wsDash.Shapes("Val_" & i)
If Not shVal Is Nothing Then
shVal.TextFrame.Characters.Text = displayVal
With shVal.TextFrame.Characters.Font
.Name = "Calibri"
.Size = IIf(i = 6, 13, 16)
.Bold = True
.Color = colors(i)
End With
End If
On Error GoTo 0
Next i
End Sub
' =============================================================================
' BUILD CHARTS
' FIX: explicit Chart.SetSourceData with the pivot table's CURRENT TableRange1
' read fresh (after RefreshAll), plus chart type assigned BEFORE styling and
' a guaranteed non-zero PlotVisibleOnly setting so empty-looking charts
' due to filtered/hidden rows don't appear blank.
' =============================================================================
Private Sub BuildCharts(wsDash As Worksheet, wsPivot As Worksheet)
MakeChart wsDash, wsPivot, "Revenue & Profit Trend", "PT_SalesTrend", xlLineMarkers, 16, 1, 33, 13
MakeChart wsDash, wsPivot, "Revenue by Category", "PT_CategoryAnalysis", xlDoughnut, 16, 14, 33, 24
MakeChart wsDash, wsPivot, "Top Products by Revenue", "PT_ProductRanking", xlBarClustered, 35, 1, 49, 13
MakeChart wsDash, wsPivot, "Supplier Revenue", "PT_SupplierPerformance", xlAreaStacked, 35, 14, 49, 24
End Sub
Private Sub MakeChart(wsDash As Worksheet, wsPivot As Worksheet, _
title As String, ptName As String, cType As Long, _
r1 As Long, c1 As Long, r2 As Long, c2 As Long)
On Error GoTo ChartErr
Dim L As Double: L = wsDash.Cells(r1, c1).Left + 3
Dim T As Double: T = wsDash.Cells(r1, c1).Top + 3
Dim W As Double: W = wsDash.Range(wsDash.Cells(r1, c1), wsDash.Cells(r1, c2)).Width - 6
Dim H As Double: H = wsDash.Range(wsDash.Cells(r1, c1), wsDash.Cells(r2, c1)).Height - 6
Dim pt As PivotTable
Set pt = wsPivot.PivotTables(ptName)
' Make sure pivot has calculated data before reading its range
pt.RefreshTable
Dim co As ChartObject
Set co = wsDash.ChartObjects.Add(L, T, W, H)
co.Name = "Cht_" & ptName
Dim cht As Chart: Set cht = co.Chart
cht.ChartType = cType
cht.SetSourceData Source:=pt.TableRange1
cht.PlotVisibleOnly = False
StyleChart cht, title
Exit Sub
ChartErr:
Debug.Print "Chart error [" & title & "]: " & Err.Description & " (continuing)"
End Sub
Private Sub StyleChart(cht As Chart, titleText As String)
On Error Resume Next
cht.ChartArea.Interior.Color = RGB(255, 255, 255)
cht.PlotArea.Interior.Color = RGB(255, 255, 255)
cht.ChartArea.Border.Color = C(210, 218, 235)
cht.ChartArea.Border.Weight = xlThin
cht.HasTitle = True
cht.ChartTitle.Text = titleText
With cht.ChartTitle.Font
.Name = "Calibri": .Size = 11: .Bold = True: .Color = C(13, 27, 42)
End With
Dim pal(1 To 6) As Long
pal(1) = C(0, 137, 123)
pal(2) = C(249, 168, 37)
pal(3) = C(63, 81, 181)
pal(4) = C(233, 30, 99)
pal(5) = C(46, 125, 50)
pal(6) = C(183, 28, 28)
Dim s As Integer
For s = 1 To cht.SeriesCollection.Count
If s <= 6 Then
cht.SeriesCollection(s).Format.Fill.ForeColor.RGB = pal(s)
cht.SeriesCollection(s).Format.Line.ForeColor.RGB = pal(s)
End If
Next s
' Pie/Doughnut charts have ONE series with multiple POINTS -- each point
' (category) must be colored individually, or every slice looks the same.
If cht.ChartType = xlDoughnut Or cht.ChartType = xlPie _
Or cht.ChartType = xlPieExploded Or cht.ChartType = xlDoughnutExploded Then
Dim pIdx As Integer
If cht.SeriesCollection.Count >= 1 Then
For pIdx = 1 To cht.SeriesCollection(1).Points.Count
cht.SeriesCollection(1).Points(pIdx).Format.Fill.ForeColor.RGB = _
pal(((pIdx - 1) Mod 6) + 1)
Next pIdx
End If
End If
' Tighten bar/column charts so they look fuller, not sparse
Select Case cht.ChartType
Case xlBarClustered, xlColumnClustered
cht.ChartGroups(1).GapWidth = 60
cht.ChartGroups(1).Overlap = -10
Case xlColumnStacked, xlBarStacked, xlAreaStacked
cht.ChartGroups(1).GapWidth = 50
End Select
cht.Axes(xlValue).MajorGridlines.Border.Color = C(225, 228, 237)
cht.Axes(xlValue).MajorGridlines.Border.Weight = xlHairline
cht.Axes(xlCategory).MajorGridlines.Delete
cht.Axes(xlValue).TickLabels.Font.Size = 7
cht.Axes(xlCategory).TickLabels.Font.Size = 7
cht.Axes(xlValue).TickLabels.Font.Color = C(80, 90, 110)
cht.Axes(xlCategory).TickLabels.Font.Color = C(80, 90, 110)
cht.ShowReportFilterFieldButtons = False
cht.ShowLegendFieldButtons = False
cht.ShowAxisFieldButtons = False
cht.ShowValueFieldButtons = False
cht.HasLegend = True
cht.Legend.Font.Size = 7
cht.Legend.Font.Color = C(55, 71, 79)
cht.Legend.Position = xlLegendPositionBottom
On Error GoTo 0
End Sub
Private Sub BuildSmallCharts(wsDash As Worksheet, wsPivot As Worksheet)
MakeChart wsDash, wsPivot, "Inventory Flow", "PT_InventoryFlow", xlColumnClustered, 61, 1, 79, 13
MakeChart wsDash, wsPivot, "Revenue vs Expenses", "PT_SalesTrend", xlColumnStacked, 61, 14, 79, 24
On Error Resume Next
Dim co As ChartObject
For Each co In wsDash.ChartObjects
If co.Name = "Cht_PT_InventoryFlow" Then
If co.Chart.SeriesCollection.Count >= 2 Then
With co.Chart.SeriesCollection(2)
.ChartType = xlLineMarkers
.AxisGroup = xlSecondary
.Format.Line.ForeColor.RGB = C(249, 168, 37)
.Format.Line.Weight = 2.25
.MarkerStyle = xlMarkerStyleCircle
.MarkerSize = 6
.MarkerForegroundColor = C(249, 168, 37)
.MarkerBackgroundColor = RGB(255, 255, 255)
End With
End If
Exit For
End If
Next co
On Error GoTo 0
End Sub
' =============================================================================
' BUILD SLICERS
' FIX v7: height is now based on the ACTUAL number of items in each field
' (header ~24px + ~17px per item, capped to a sane range) so there's no
' empty dead space below short lists. Uses the genuine built-in slicer
' style "SlicerStyleDark3" (a real Excel built-in name) for strong navy/
' dark contrast against our panel -- no fabricated SlicerStyle API used.
' =============================================================================
Private Sub BuildSlicers(wb As Workbook, wsDash As Worksheet, wsPivot As Worksheet)
On Error GoTo SlicerErr
With wsDash.Range("Y2:AB2")
.Merge
.Value = " SMART FILTERS"
.Interior.Color = C(13, 27, 42)
.Font.Name = "Calibri": .Font.Size = 9
.Font.Bold = True: .Font.Color = RGB(255, 255, 255)
.HorizontalAlignment = xlHAlignLeft
.VerticalAlignment = xlVAlignCenter
End With
With wsDash.Range("Y3:AB3")
.Interior.Color = C(0, 137, 123)
End With
' "SlicerStyleDark3" is a real built-in slicer style (dark theme, good
' contrast against our navy panel). Using a verified built-in name avoids
' any custom-style API, which is not safely scriptable from VBA.
Dim styleName As String
styleName = "SlicerStyleDark3"
Dim fields(0 To 3) As String
Dim ptNames(0 To 5) As String
fields(0) = COL_MONTH: fields(1) = COL_CATEGORY
fields(2) = COL_SUPPLIER: fields(3) = COL_PRODUCT
ptNames(0) = "PT_SalesTrend": ptNames(1) = "PT_CategoryAnalysis"
ptNames(2) = "PT_ProductRanking": ptNames(3) = "PT_SupplierPerformance"
ptNames(4) = "PT_InventoryFlow": ptNames(5) = "PT_Profitability"
Dim slLeft As Double: slLeft = wsDash.Cells(6, 25).Left + 4
Dim slWidth As Double: slWidth = wsDash.Range(wsDash.Cells(6, 25), wsDash.Cells(6, 28)).Width - 8
Dim panelTop As Double: panelTop = wsDash.Cells(6, 25).Top + 4
Dim panelBottom As Double: panelBottom = wsDash.Cells(80, 25).Top ' bottom limit of slicer panel
Dim gap As Double: gap = 8
Dim slTop As Double: slTop = panelTop
Dim itemRowH As Double: itemRowH = 17
Dim headerH As Double: headerH = 24
Dim i As Integer
For i = 0 To 3
Dim sc As SlicerCache
Set sc = Nothing
On Error Resume Next
Set sc = wb.SlicerCaches.Add2(wsPivot.PivotTables(ptNames(0)), fields(i))
On Error GoTo 0
If Not sc Is Nothing Then
Dim itemCount As Long
itemCount = 5
On Error Resume Next
itemCount = sc.SlicerCacheLevels(1).SlicerItems.Count
On Error GoTo 0
If itemCount < 1 Then itemCount = 1
Dim slHeight As Double
slHeight = headerH + (itemCount * itemRowH)
If slHeight > 165 Then slHeight = 165
If slHeight < 70 Then slHeight = 70
If slTop + slHeight > panelBottom Then
slHeight = panelBottom - slTop - 4
If slHeight < 50 Then slHeight = 50
End If
Dim sl As Slicer
Set sl = Nothing
On Error Resume Next
Set sl = sc.Slicers.Add(wsDash, , "SL_" & fields(i), fields(i), _
slTop, slLeft, slWidth, slHeight)
On Error GoTo 0
If Not sl Is Nothing Then
On Error Resume Next
sl.Style = styleName
If Err.Number <> 0 Then
Err.Clear
sl.Style = "SlicerStyleLight1"
End If
sl.NumberOfColumns = 1
On Error GoTo 0
End If
Dim j As Integer
For j = 1 To 5
On Error Resume Next
sc.PivotTables.AddPivotTable wsPivot.PivotTables(ptNames(j))
On Error GoTo 0
Next j
slTop = slTop + slHeight + gap
End If
Next i
Exit Sub
SlicerErr:
Debug.Print "Slicer: " & Err.Description & " (continuing)"
End Sub
' =============================================================================
' INSIGHTS PANEL
' FIX: instead of hardcoded row ranges that broke when pivot sizes differed,
' each formula now reads the LIVE label/value ranges directly from the
' PivotTable object's RowRange / DataBodyRange, so it is always correct
' no matter how many categories, products, suppliers or months exist.
' =============================================================================
Private Sub BuildInsights(wsDash As Worksheet, wsPivot As Worksheet)
Dim pv As String: pv = wsPivot.Name
With wsDash.Range("A51:X51")
.Merge
.Value = " EXECUTIVE INSIGHTS | Key Performance Highlights"
.Interior.Color = C(13, 27, 42)
.Font.Name = "Calibri": .Font.Size = 9
.Font.Bold = True: .Font.Color = RGB(255, 255, 255)
.HorizontalAlignment = xlHAlignLeft
.VerticalAlignment = xlVAlignCenter
End With
wsDash.Rows(51).RowHeight = 18
Dim lbl(1 To 6) As String
lbl(1) = "Highest Revenue Category"
lbl(2) = "Best Performing Product"
lbl(3) = "Top Supplier"
lbl(4) = "Most Profitable Category"
lbl(5) = "Best Revenue Month"
lbl(6) = "Lowest Expense Month"
Dim clr(1 To 6) As Long
clr(1) = C(0, 137, 123): clr(2) = C(46, 125, 50)
clr(3) = C(13, 27, 42): clr(4) = C(106, 27, 154)
clr(5) = C(249, 168, 37): clr(6) = C(21, 101, 192)
Dim icons(1 To 6) As String
icons(1) = " REV ": icons(2) = " PRD ": icons(3) = " SUP "
icons(4) = " PRO ": icons(5) = " MON ": icons(6) = " EXP "
' --- Compute insight values directly in VBA (100% reliable, no fragile
' range-address formulas that can silently fail to parse) ---
Dim val(1 To 6) As String
val(1) = TopLabelByValue(wsPivot, "PT_CategoryAnalysis", COL_CATEGORY, 1, True)
val(2) = TopLabelByValue(wsPivot, "PT_ProductRanking", COL_PRODUCT, 1, True)
val(3) = TopLabelByValue(wsPivot, "PT_SupplierPerformance", COL_SUPPLIER, 1, True)
val(4) = TopLabelByValue(wsPivot, "PT_CategoryAnalysis", COL_CATEGORY, 2, True)
val(5) = TopLabelByValue(wsPivot, "PT_SalesTrend", COL_MONTH, 1, True)
val(6) = TopLabelByValue(wsPivot, "PT_SalesTrend", COL_MONTH, 3, False)
Dim k As Integer
For k = 1 To 6
Dim ir As Long: ir = 51 + k
wsDash.Rows(ir).RowHeight = 15
With wsDash.Cells(ir, 1)
.Value = icons(k)
.Interior.Color = clr(k)
.Font.Name = "Calibri": .Font.Size = 7
.Font.Bold = True: .Font.Color = RGB(255, 255, 255)
.HorizontalAlignment = xlHAlignCenter
.VerticalAlignment = xlVAlignCenter
End With
With wsDash.Range(wsDash.Cells(ir, 2), wsDash.Cells(ir, 10))
.Merge
.Value = " " & lbl(k)
.Interior.Color = RGB(255, 255, 255)
.Font.Name = "Calibri": .Font.Size = 8
.Font.Bold = True: .Font.Color = clr(k)
.HorizontalAlignment = xlHAlignLeft
.VerticalAlignment = xlVAlignCenter
End With
With wsDash.Range(wsDash.Cells(ir, 11), wsDash.Cells(ir, 24))
.Merge
.NumberFormat = "General"
.Value = val(k)
.Interior.Color = C(244, 246, 251)
.Font.Name = "Calibri": .Font.Size = 9
.Font.Bold = True: .Font.Color = C(13, 27, 42)
.HorizontalAlignment = xlHAlignLeft
.VerticalAlignment = xlVAlignCenter
.IndentLevel = 1
End With
With wsDash.Range(wsDash.Cells(ir, 1), wsDash.Cells(ir, 24)).Borders(xlEdgeBottom)
.LineStyle = xlContinuous
.Color = C(210, 218, 235)
.Weight = xlHairline
End With
Next k
BuildSmallCharts wsDash, wsPivot
End Sub
' Loops a pivot table's data rows directly (in VBA, not via formula) and
' returns the row label corresponding to the max (or min) value in the
' given data-field column. 100% reliable regardless of pivot size/shape.
' ptName = name of the pivot table
' rowField = name of the row field (used only for reference/clarity)
' dataCol = 1-based column index within the pivot's data area
' findMax = True for MAX, False for MIN
Private Function TopLabelByValue(wsPivot As Worksheet, ptName As String, _
rowField As String, dataCol As Long, _
findMax As Boolean) As String
On Error GoTo Fail
Dim pt As PivotTable: Set pt = wsPivot.PivotTables(ptName)
Dim labelRng As Range: Set labelRng = pt.RowRange
Dim dataRng As Range: Set dataRng = pt.DataBodyRange
If labelRng Is Nothing Or dataRng Is Nothing Then GoTo Fail
If dataCol > dataRng.Columns.Count Then dataCol = 1
Dim bestLabel As String, bestVal As Double, started As Boolean
Dim r As Long, lblText As String, v As Variant
' RowRange includes the field header row; skip rows whose label is blank
' or matches a grand total caption.
For r = 1 To labelRng.Rows.Count
lblText = CStr(labelRng.Cells(r, 1).Value)
If Len(Trim(lblText)) > 0 And InStr(1, lblText, "Grand Total", vbTextCompare) = 0 _
And r <= dataRng.Rows.Count Then
v = dataRng.Cells(r, dataCol).Value
If IsNumeric(v) Then
If Not started Then
bestVal = CDbl(v): bestLabel = lblText: started = True
ElseIf (findMax And CDbl(v) > bestVal) Or (Not findMax And CDbl(v) < bestVal) Then
bestVal = CDbl(v): bestLabel = lblText
End If
End If
End If
Next r
If started Then
TopLabelByValue = bestLabel
Else
TopLabelByValue = "N/A"
End If
Exit Function
Fail:
TopLabelByValue = "N/A"
End Function
' =============================================================================
' FINAL POLISH
' =============================================================================
Private Sub FinalPolish(wsDash As Worksheet, wsPivot As Worksheet)
On Error Resume Next
ThisWorkbook.RefreshAll
Application.Calculate
On Error GoTo 0
PopulateKPIValues wsDash
wsDash.Columns(25).Font.Color = C(244, 246, 251)
wsDash.Columns(25).Interior.Color = C(244, 246, 251)
wsDash.Activate
ActiveWindow.DisplayGridlines = False
ActiveWindow.Zoom = 75
wsDash.Range("A5").Select
ActiveWindow.FreezePanes = True
wsDash.Tab.Color = C(13, 27, 42)
wsPivot.Tab.Color = C(0, 137, 123)
wsPivot.Activate
wsPivot.Columns.AutoFit
wsDash.Activate
wsDash.Range("A1").Select
End Sub
' =============================================================================
' GENERIC HELPERS
' =============================================================================
Public Function GetLastRow(ws As Worksheet, col As Long) As Long
GetLastRow = ws.Cells(ws.Rows.Count, col).End(xlUp).Row
End Function
Public Function GetLastCol(ws As Worksheet, rowNum As Long) As Long
GetLastCol = ws.Cells(rowNum, ws.Columns.Count).End(xlToLeft).Column
End Function
Public Function GetWS(wsName As String) As Worksheet
On Error Resume Next
Set GetWS = ThisWorkbook.Worksheets(wsName)
On Error GoTo 0
End FunctionDashboard Download(without VBA)
Trending Dashboads
- I Built an Automated Inventory Dashboard in Excel VBA That Creates Everything in Just 25 Seconds
- I Built a Complete Excel Dashboard in 60 Seconds! Using VBA — Here’s How It Changed My Workflow
- How to Create an Interactive Excel Sales Dashboard from Raw Data (Step-by-Step Guide-2026)
- How to Create a Stunning Global Sales Dashboard in Excel (Step-by-Step Guide-2026)
- Project INSPECT: School Infrastructure Monitoring System & Dashboard 2026
- Free Inventory Management System in Excel – Complete Dashboard with Download 2026
Final Thoughts
The Inventory Intelligence Center is more than just a dashboard.
It is a decision-making system built inside Excel.
By combining automated KPIs, dynamic charts, supplier analytics, inventory flow monitoring, executive insights, and interactive filtering, it gives businesses the visibility they need to make smarter decisions and improve performance.
Whether you’re managing a warehouse, retail operation, distribution business, or manufacturing company, one thing is clear:
Better inventory intelligence leads to better business outcomes.

