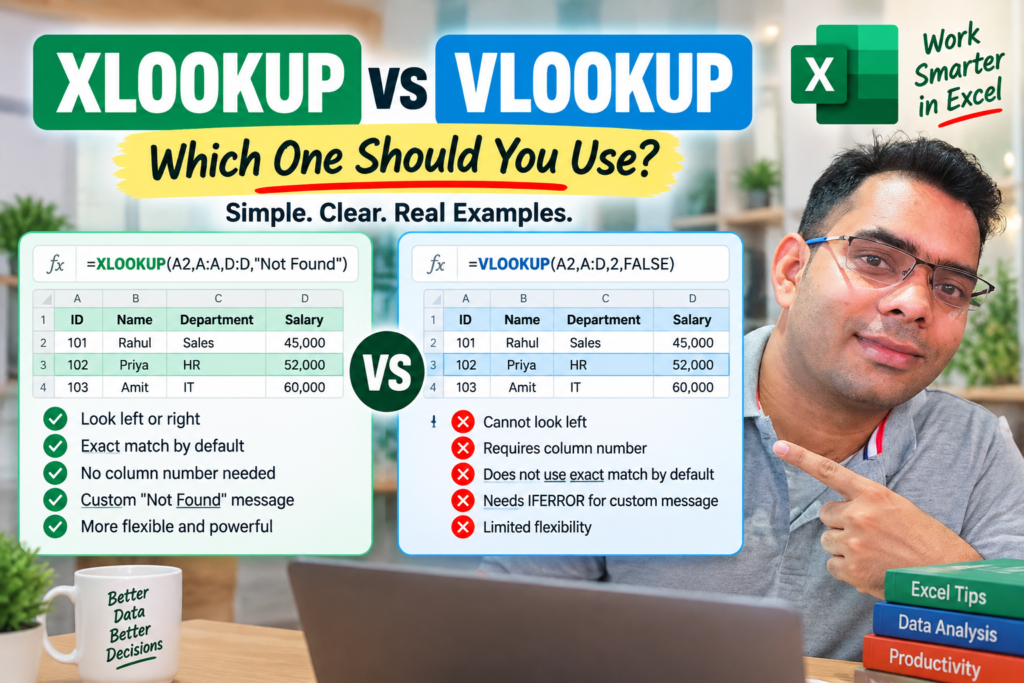
XLOOKUP vs VLOOKUP in Excel 365 : If you are still using VLOOKUP for everything, you may be making your Excel work harder than it needs to be. For years,…
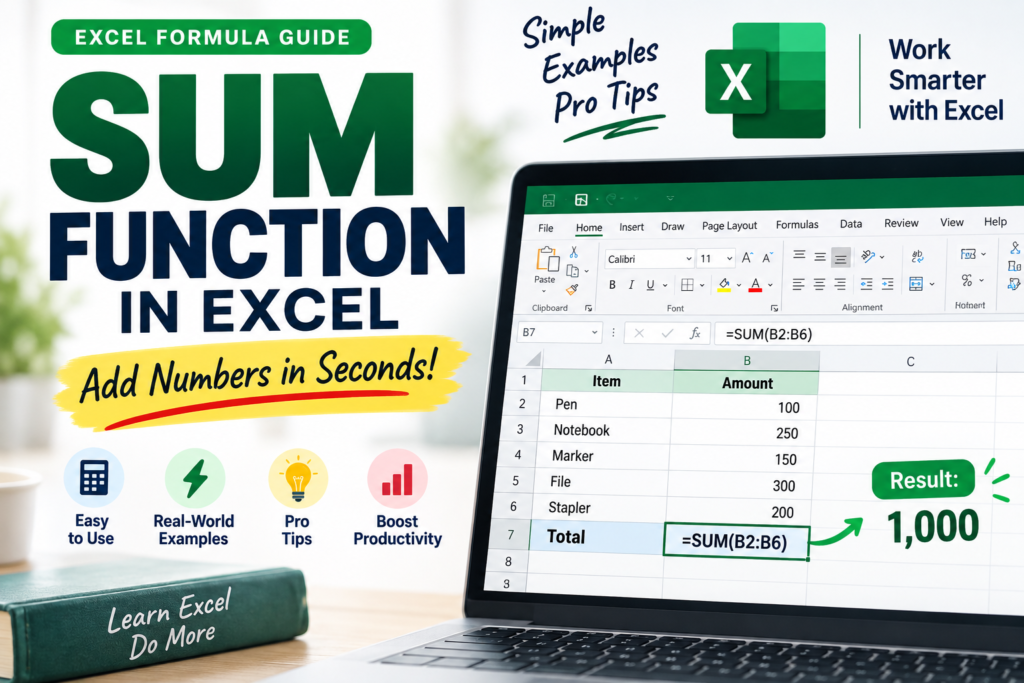
SUM Function in Excel: Formula, Examples, Syntax and Tips Learn how to use the SUM function in Excel with simple examples. Discover SUM syntax, multiple ranges, entire columns, rows, SUMIF,…
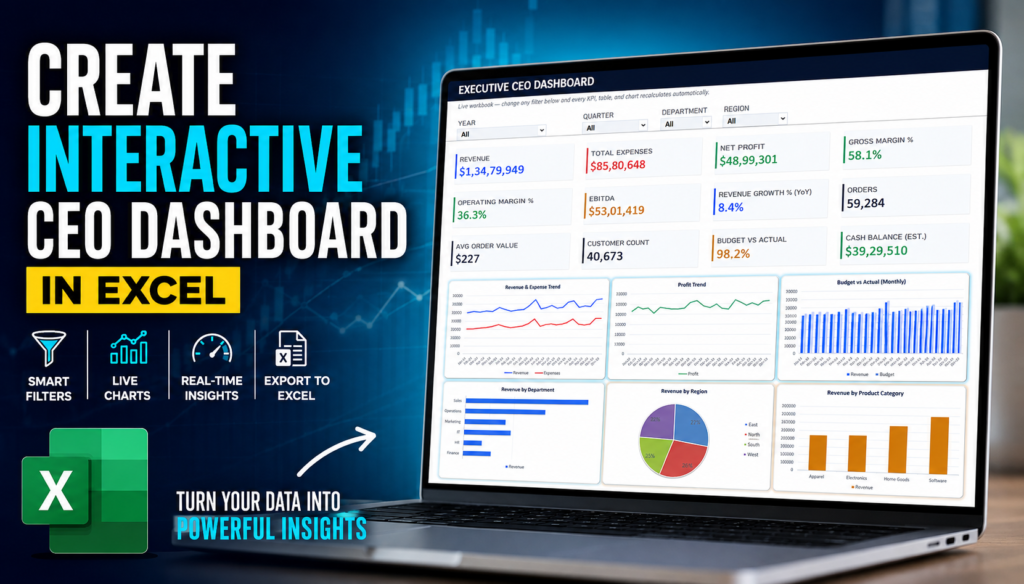
CEO Performance Dashboard:-Business leaders don't need more spreadsheets—they need a clear view of what the numbers are actually saying. A CEO or business decision-maker often needs answers to important questions…
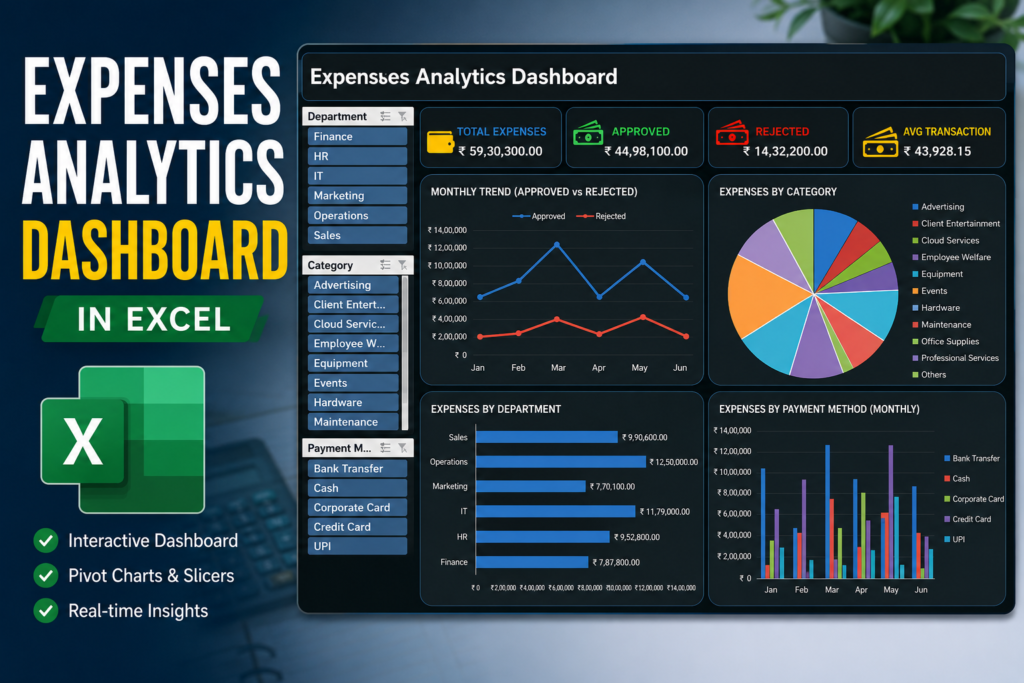
Learn how to build an interactive Expenses Analytics Dashboard in Excel using Pivot Tables, Pivot Charts, KPI cards, and slicers with this step-by-step tutorial. Managing expenses in Excel is easy.…
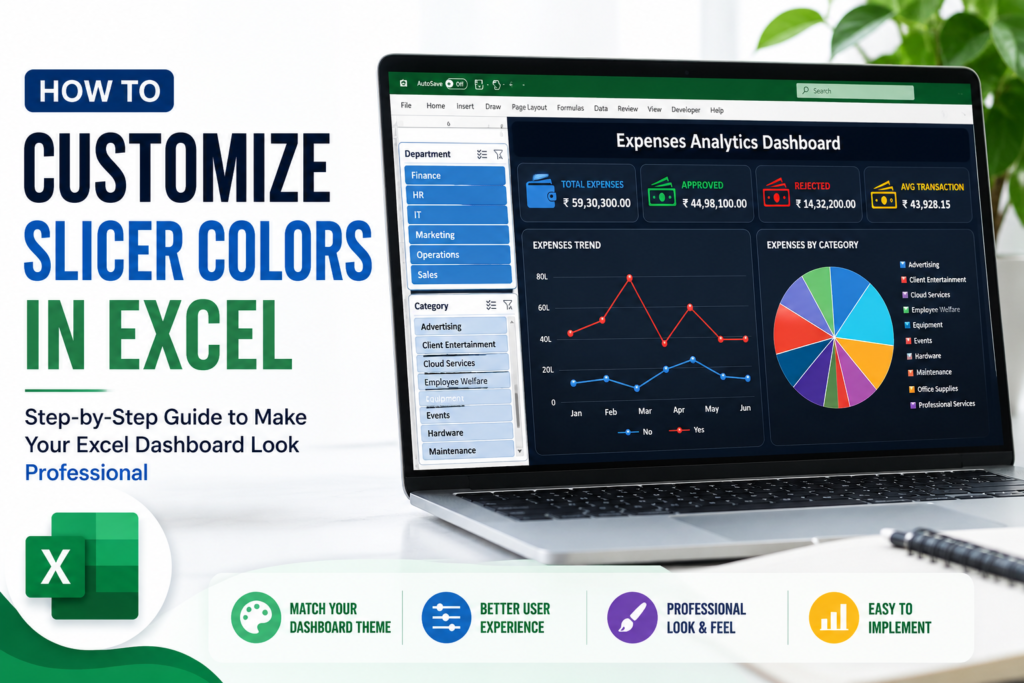
How to Customize Slicer Colors in Excel:- A well-designed Excel dashboard is not just about charts and numbers. The small details also matter. One of the easiest ways to make…
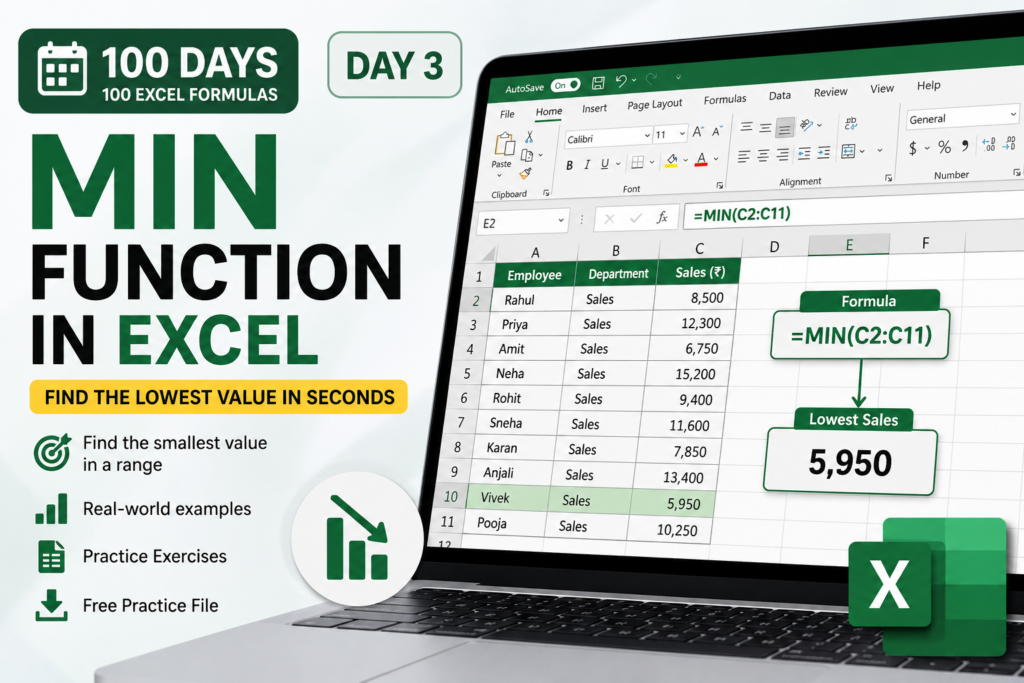
Day 3 of 100 Days • 100 Excel Formulas (MIN Function in Excel) Finding the lowest number in a large Excel dataset doesn't need to involve manually scanning rows and…
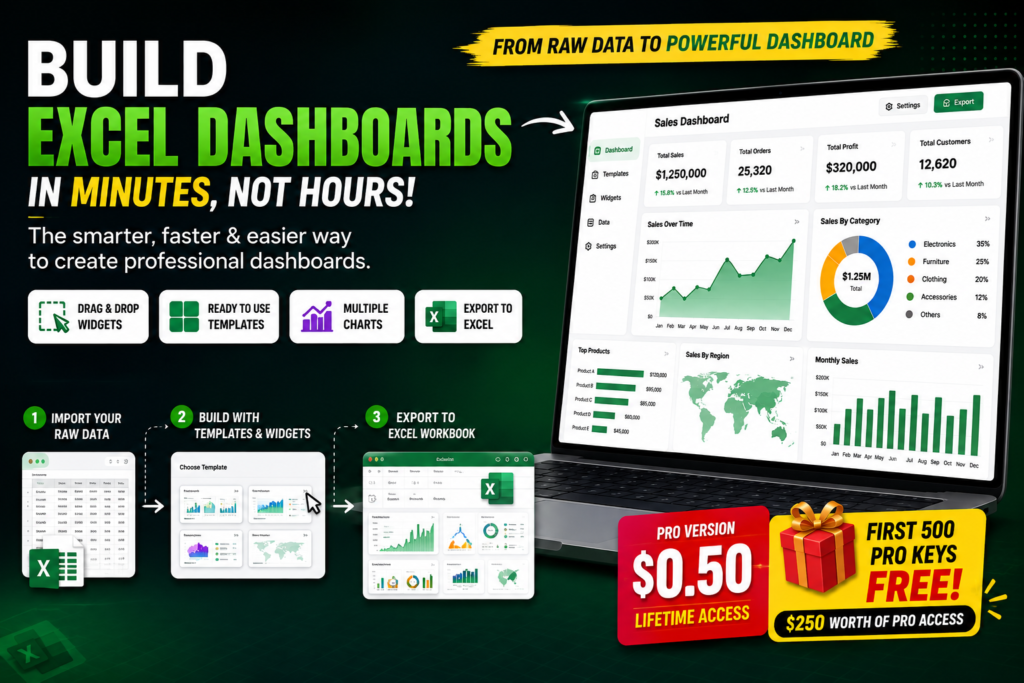
Excel Dashboards If you have ever built an Excel dashboard from scratch, you probably know how quickly a “simple report” can turn into a few hours of work. First, you…
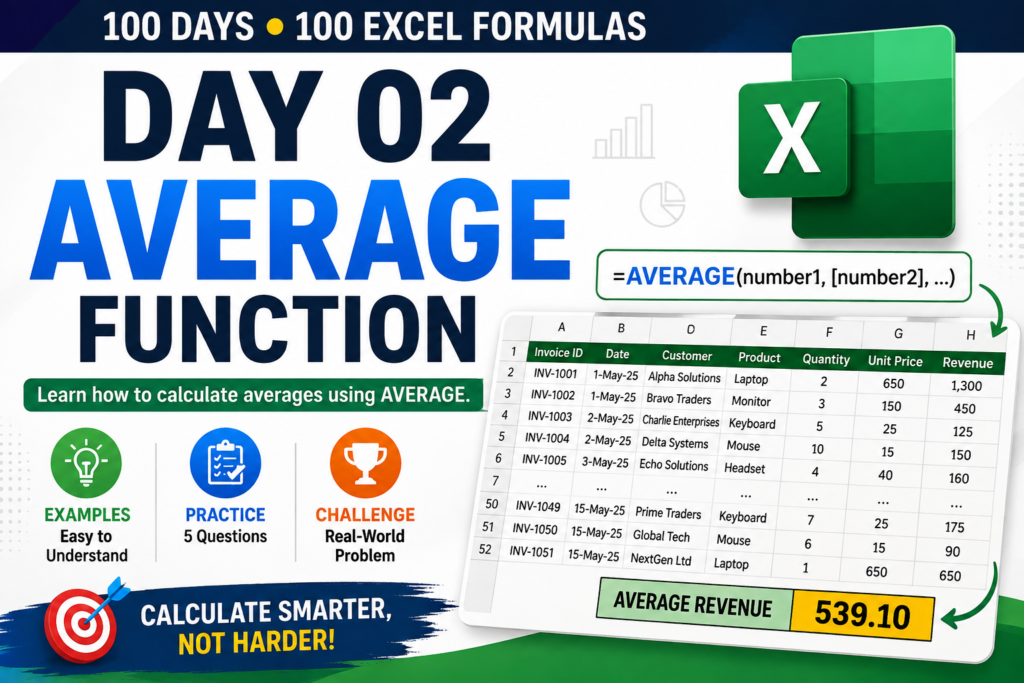
100 Days • 100 Excel Formulas — Day 2 Calculating a total is useful, but sometimes a total doesn't tell the complete story. For example, imagine you have 50 sales…
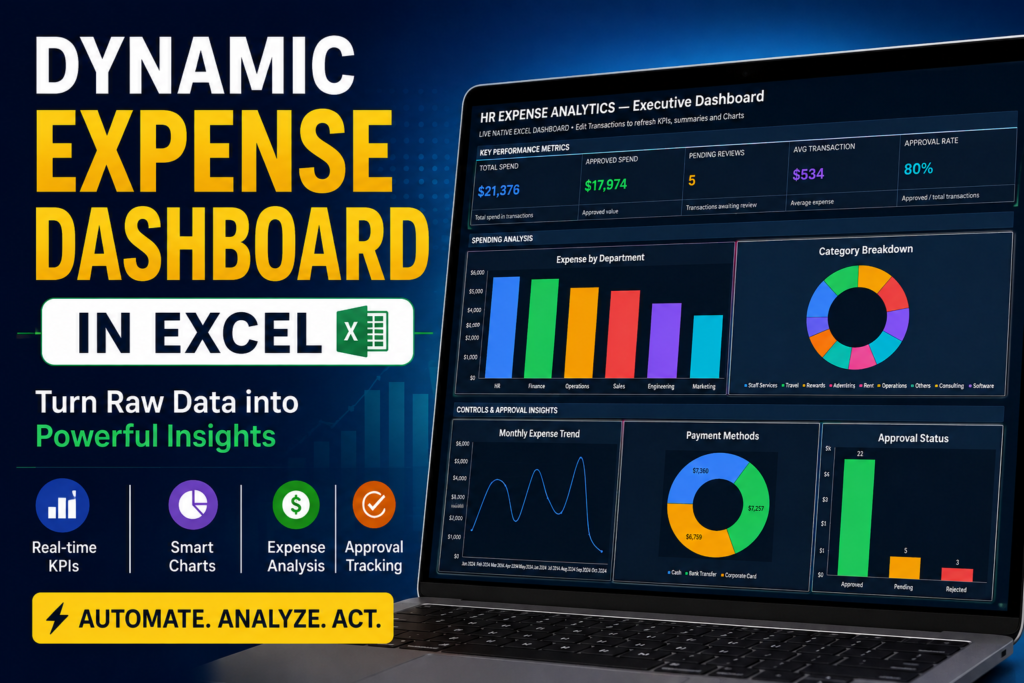
Dynamic Expense Dashboard in Excel: Turn Raw Data Into a Professional Report Learn how to turn raw expense data into a dynamic Excel dashboard with KPIs, department analysis, category breakdowns,…
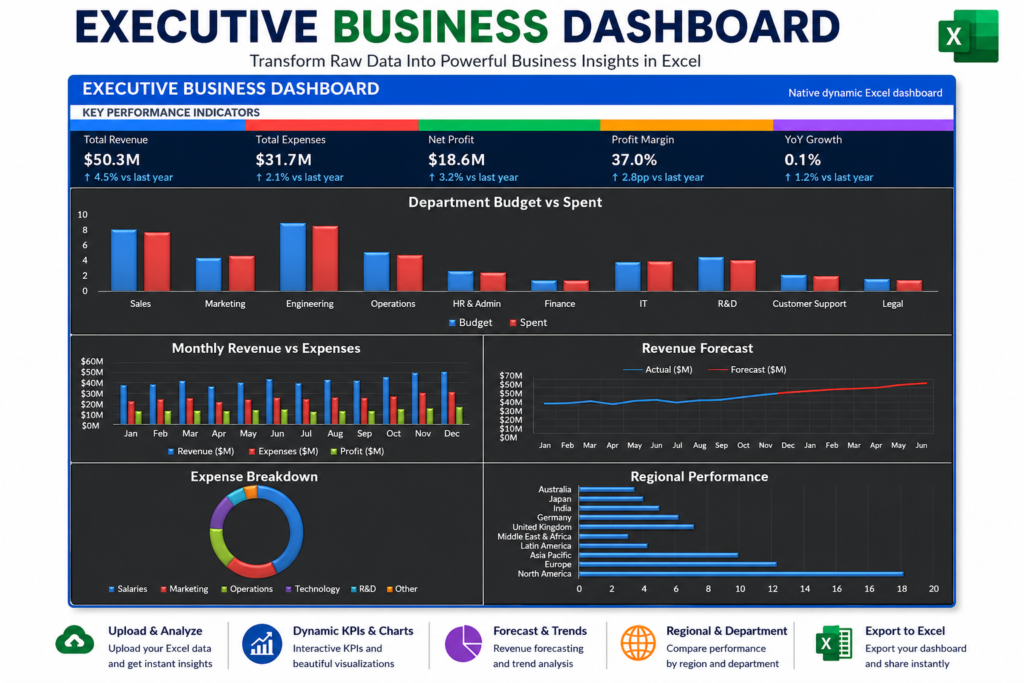
Executive Business Dashboard in Excel | Professional KPI Dashboard Discover how an Executive Business Dashboard in Excel transforms raw business data into KPIs, YoY growth, forecasts, regional analysis, department performance,…